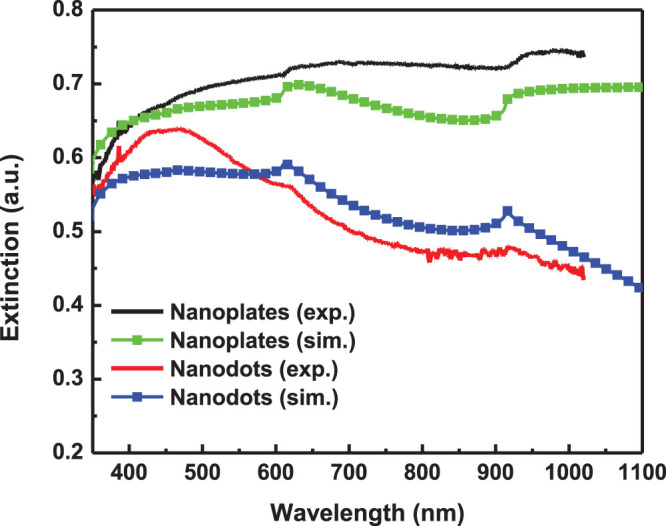
Figure 6. Experiment (exp.) and simulation (sim.) extinction spectra silver nanoplate and nanodot based macro-periodic structure.

The black and red curves are the experimental results results of periodicity 610 nm before and after annealing respectively. The green and blue square curves are the simulated extinction spectra (σ = 0.15; fd = 0.6; and L1 = L2 = 0.2, L3 = 0.6 for silver nanoplate, L1 = L2 = L3 = 1 / 3 for silver nanodots). The periodicity, width and height of silver strips in simulation are 610 nm, 400 nm and 50 nm, respectively.
