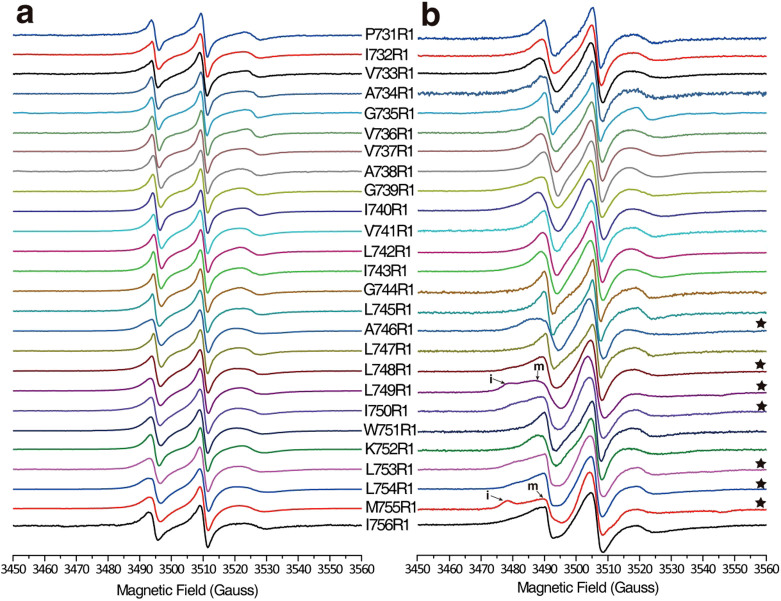
Figure 2. EPR spectra of spin-labeled integrin β1a-TMC scanning the transmembrane region P731–I756.
(a) EPR spectra of integrin β1a-TMC in LDAO micelles. (b) EPR spectra of integrin β1a-TMC reconstituted in POPC/POPG liposomes. Each spectrum was normalized by the height of the central peak. Asterisks indicate spectra that exhibit multiple components in lipid liposomes. “i” and “m” represent the “immobile” and “mobile” components, respectively, on the spectra of L749R1 and M755R1.

