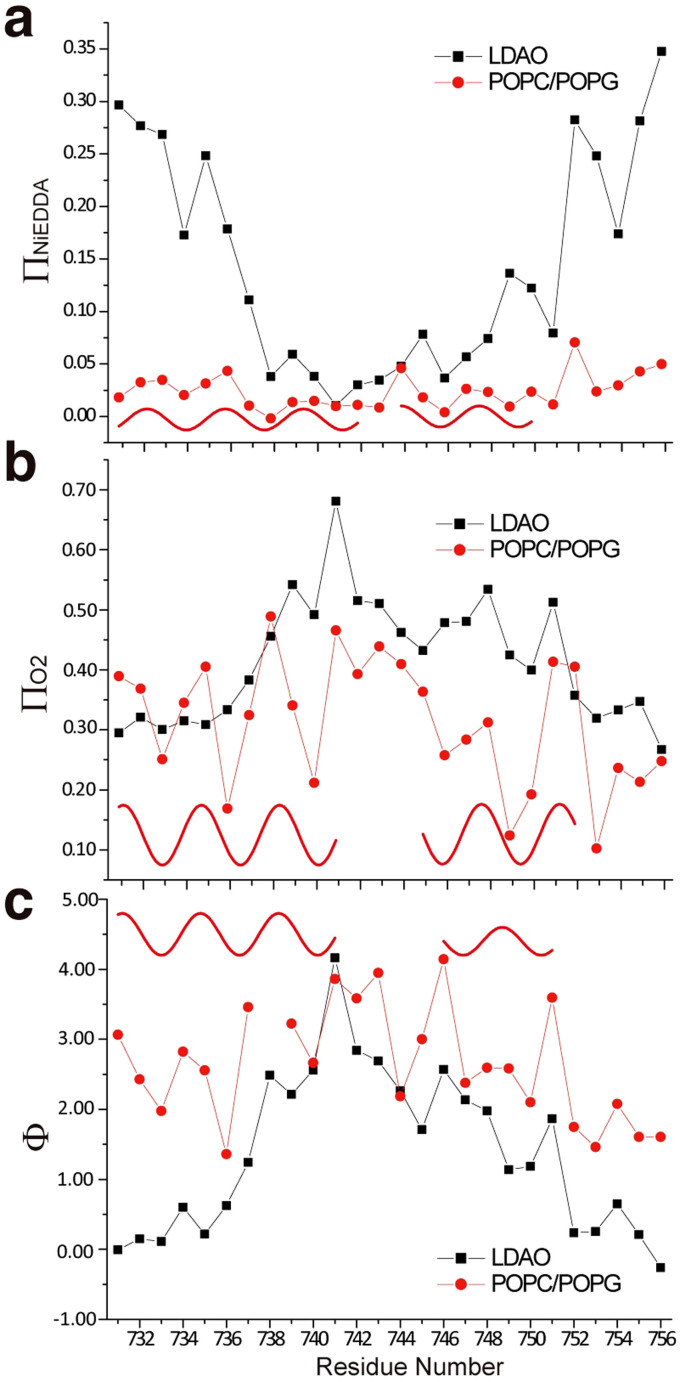
Figure 6. EPR accessibility analysis of integrin β1a-TMC in LDAO micelles and in POPC/POPG liposomes using power saturation experiments.
Residue-specific environmental parameter profiles: NiEDDA accessibility parameter (ΠNiEDDA, panel a), oxygen accessibility parameter (ΠO2, panel b) and the corresponding depth parameter (Φ, panel c) in LDAO micelles (black squares) and in POPC/POPG liposomes (red dots) were plotted versus the residue number. Sine waves were drawn to illustrate the observed periodicity indicative of a helical structure in POPC/POPG liposomes.

