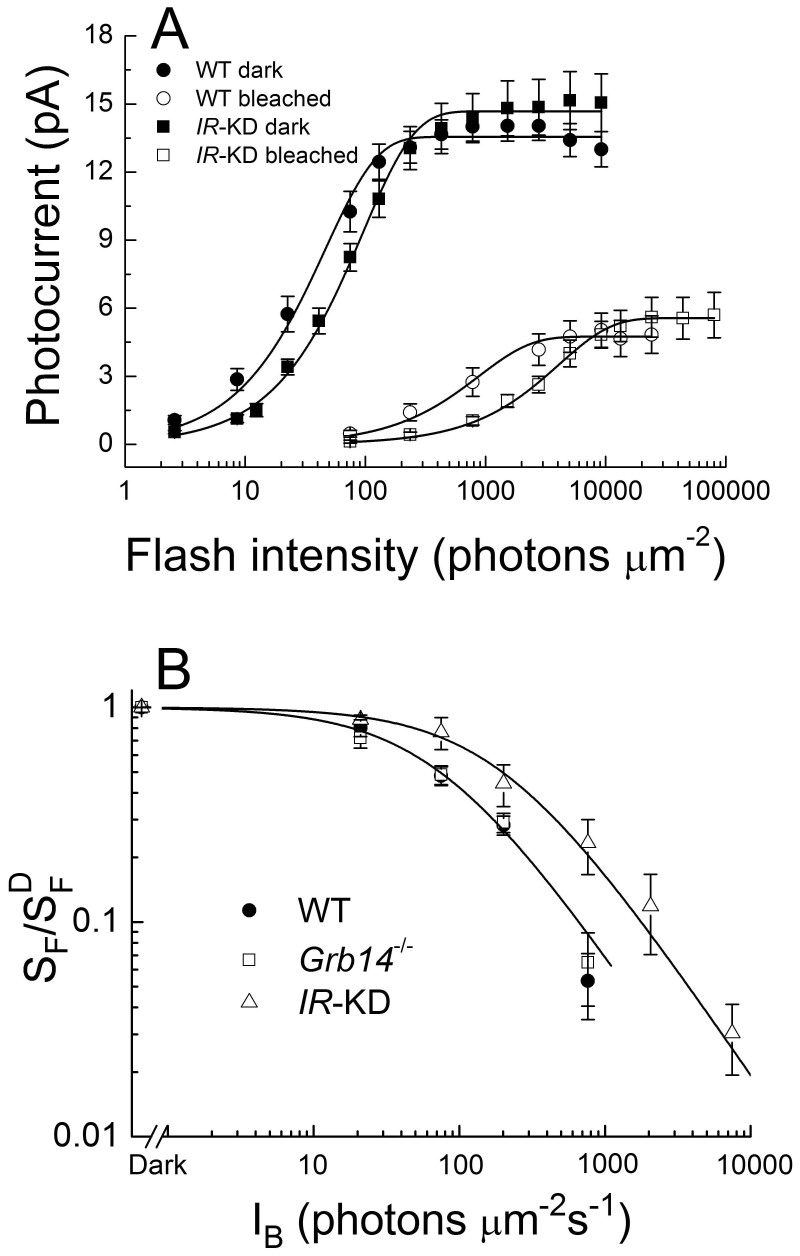
Figure 5. IR knock-down rods are less sensitive than WT rods.
A, response-intensity functions for WT strain control rods and IR knock-down rods (IR-KD), dark-adapted or at steady state after bleaching 50% of the visual pigment. Data were taken from the same rods as in Fig. 3 and have been fitted with the function r = rmax [1-exp(-kI)], where r is the mean peak amplitude of the response, rmax is the maximum value of r, k is a constant, and I is the flash intensity in units of photons μm−2. Data points are means ± SEM of 21 dark-adapted WT rods (•) with rmax = 13.6 pA and k = 0.022 photons−1 μm2; 9 bleached WT rods (○) with rmax = 4.7 pA and k = 0.0011 photons−1 μm2; 16 dark-adapted IR knock-down rods (▪) with rmax = 14.7 pA and k = 0.011 photons−1 μm2; and 8 bleached IR knock-down rods (□) with rmax = 5.6 pA and k = 2.4 × 10⁻⁴ photons−1 μm2. B, mean sensitivity as a function of background light intensity for 5 WT rods (•), 5 Grb14−/− rods (□), and 5 IR knock-down rods (Δ). Sensitivity (SF) has been calculated by dividing the peak amplitude of small-amplitude flash responses by the flash intensity and has been normalized to the dark-adapted sensitivity  . Data points give means ± SEM and have been fitted with the Weber-Fechner function, SF/
 = I0/(I0 + IB), where IB is the intensity of the steady background light in photons μm−2 s−1 and I0 is a constant. Best-fitting values for I0 were 73 photons μm−2 s−1 (WT), 68 photons μm−2 s−1 (Grb14−/−), and 197 photons μm−2 s−1 (IR knock down); only curves for WT and IR knock down are shown.

