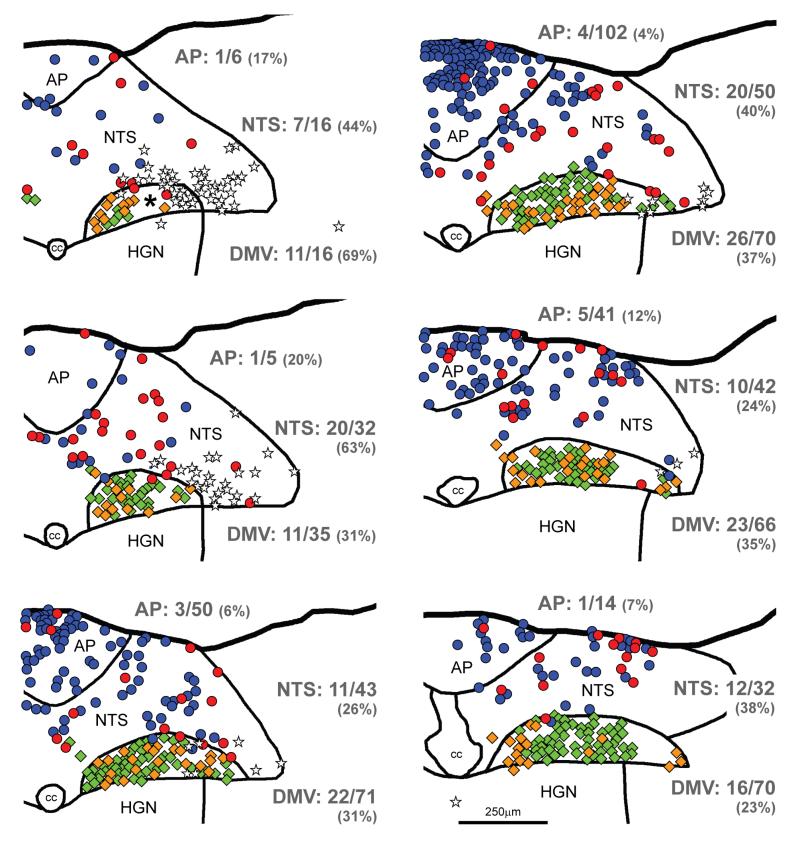
FIGURE 2.
Maps of sections through the dorsal vagal complex of a YFP-PPG mouse showing the distribution of ChAT-immunoreactive and TH-immunoreactive neurons with and without close appositions from YFP-immunoreactive varicosities. Sections were triple-stained to reveal YFP, TH and ChAT. Every third section was mapped; maps are therefore separated by 60μm. The most caudal section is at the top left of the figure and the most rostral section is at the bottom right. TH-immunoreactive neurons in the nucleus tractus solitarius (NTS) and area postrema (AP) are represented by circles; and ChAT-immunoreactive neurons, predominantly in the dorsal motor nucleus of the vagus (DMV), by diamonds. TH-immunoreactive neurons that receive close appositions from YFP-immunoreactive varicosities are shown in red; those that do not receive appositions are shown in blue. ChAT-immunoreactive neurons that receive close appositions from YFP-immunoreactive varicosities are shown in gold; those that do not receive appositions are shown in green. The cell bodies of YFP-PPG neurons are represented by white stars. Numerical values indicate the proportion of neurons in each region that received close appositions from YFP-immunoreactive varicosities. The percentages of neurons that received YFP- immunoreactive appositions in each region are given in parentheses. The asterisk indicates an area of the DMV in which appositions could not be assessed because the dendrites of YFP-PPG neurons were too dense. cc, central canal; HGN, hypoglossal nucleus.

