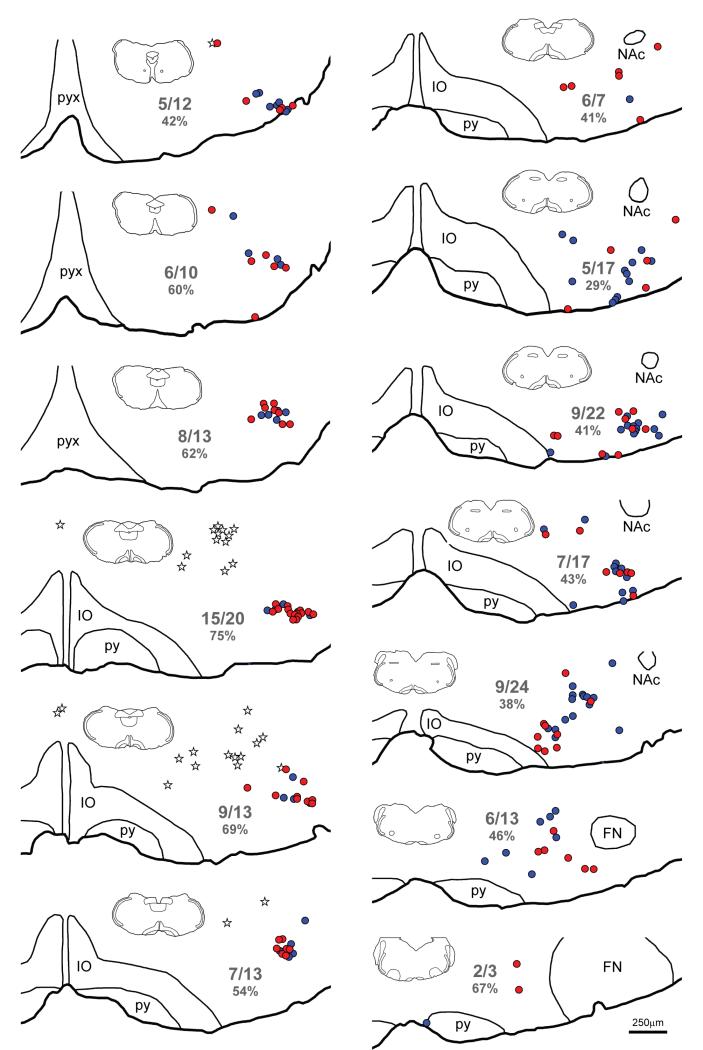
FIGURE 4.
Maps of sections through the ventral medulla of a YFP-PPG mouse showing the distribution of TH-immunoreactive neurons with and without close appositions from YFP-immunoreactive varicosities. Sections were triple-stained to reveal YFP, TH and ChAT. Every sixth section was mapped; maps are therefore separated by 150μm. The most caudal section is at the top left of the figure and the most rostral section is at the bottom right. TH-immunoreactive neurons that receive close appositions from YFP-immunoreactive varicosities are represented by red circles; TH-immunoreactive neurons that do not receive appositions are represented by blue circles. The cell bodies of YFP-PPG neurons are represented by white stars. Numerical values indicate the proportion of neurons in each section that received close appositions from YFP-immunoreactive varicosities. The percentages of neurons that received YFP- immunoreactive appositions in each section are given in parentheses. The insets show the entire section from which each map was constructed, allowing the dorsoventral tilt of the section can be assessed. FN, facial nucleus; IO, inferior olive; NAc, compact formation of the nucleus ambiguus; py, pyramidal tract; pyx, pyramidal decussation.

