
Fig. 1.
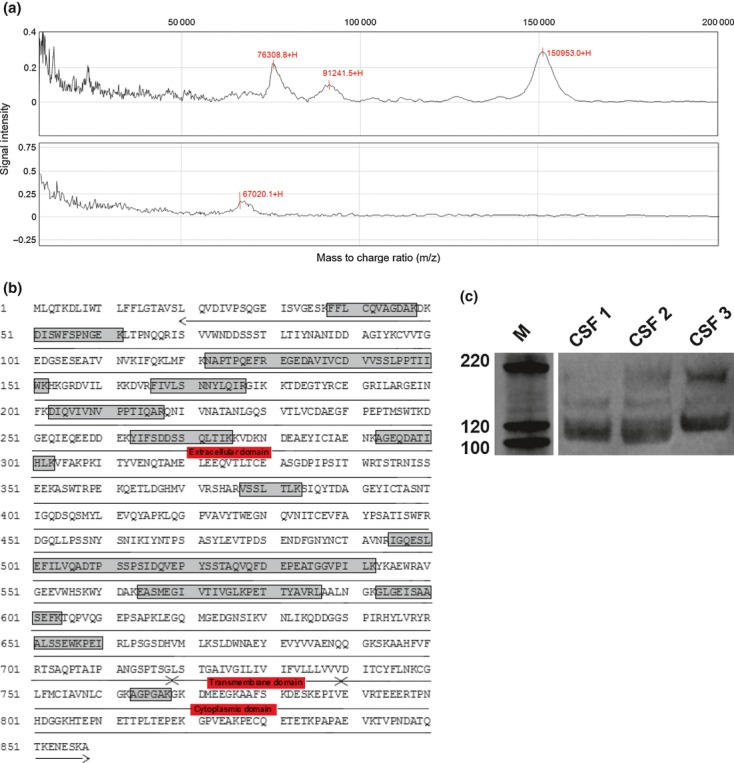
(a) Representative Surface-enhanced laser desorption/ionization-TOF mass spectrometry (MS) spectra from an MS patient (top) with a control experiment with 0.2% bovine serum albumin only (bottom); m/z ratio of the peaks are annotated; (b) ESI Q-TOF sequence mapping for CSF neural cell adhesion molecule (NCAM), the peptide data (noted by the boxed areas) mark sites of coverage on the NCAM sequence and the topological domains (annotated by arrows); and (c) western blot analysis of NCAM in the CSF of three MS patients showing the three major isoforms.