
Figure 4.
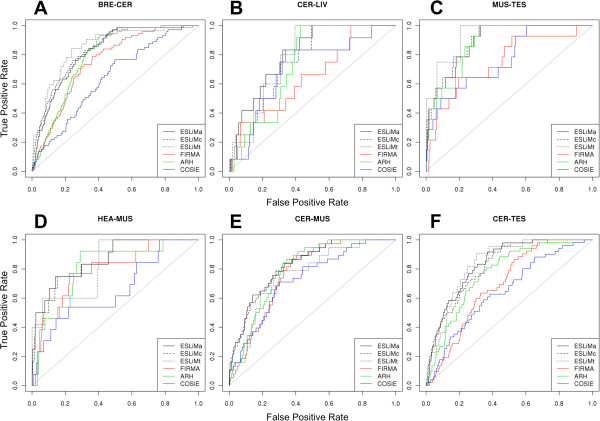
ROC curves comparing the performance of five methods to identify splicing events in six tissue pairs. The curves display the true positive rates versus the false positive rates (i.e. “sensitivity” versus “1–specificity”). The panels A-F correspond to the following tissue pairs: (A) BRE-CER breast and cerebellum; (B) CER-LIV cerebellum and liver; (C) MUS-TES muscle and testis; (D) HEA-MUS heart and muscle; (E) CER-MUS cerebellum and muscle; (F) CER-TES cerebellum and testis. A label indicating the color line that corresponds to each method is included in a box inside each plot: ESLiMa (black line), ESLiMc (black dashed line), ESLiMt (black dotted line), FIRMA (red), ARH (green) and COSIE (blue).