Figure 7.

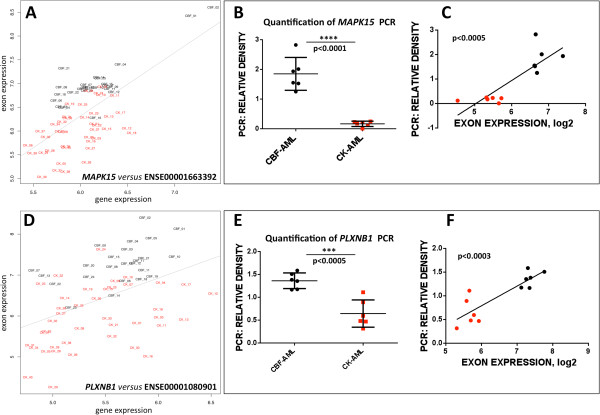
Quantification of the relative expression of MAPK15 and PLXNB1 splice variants in two subtypes of acute myeloid leukemia. (A) ESLiMc correlation plot of exon expression (exon ID: ENSE00001663392) of MAPK15 versus gene expression using the normalized expression signals calculated as indicated in Methods. (B) Quantification of MAPK15 splice variant expression by measuring the relative density of MAPK15 PCR product in ImageJ software (showing a significant differentially expression between CBF- and CK-AML). (C) Correlation plot of relative density of PCR product with ENSE00001663392 expression values. Relative density of PCR product is plotted along the x-axis and mean log2 transformed probeset intensities for ENSE00001663392 (Affymetrix probeset IDs 3119813, 3119814) are shown along y-axis. CK-AML (red dots) correspond to AML with complex karyotype, and CBF-AML (black dots) to core binding factor AML. (D) ESLiMc correlation plot of exon expression (exon ID: ENSE00001080901) of PLXNB1 versus gene expression using the normalized expression signals calculated as indicated in Methods. (E) Quantification of PLXNB1 splice variant expression by measuring of PCR bands intensities in ImageJ software (this shows a significantly higher expression of PLXNB1 splice isoforms in CBF-AML, which is in agreement with ESLiM correlation plot on D). (F) Correlation of relative PCR band intensities of PLXNB1 splice variants with ENSE00001080901 exon expression. Relative density of PCR product is plotted along the x-axis and mean log2 transformed probe set intensities for ENSE00001080901 (Affymetrix probeset ID 2673238) are shown along y-axis.
