
Figure 3.
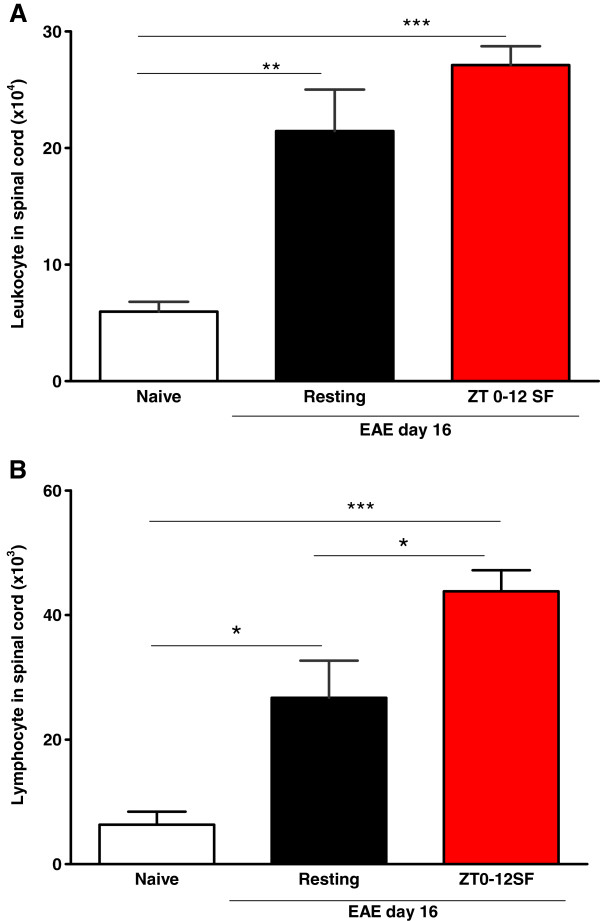
Histograms showing both resting EAE and SF EAE (ZT 0–12 SF) mice on day 16 showed an increased infiltration of (A) leukocytes (CD45 + cells) and (B) the lymphocyte population (low granularity and high CD45 immunofluorescent intensity) in the spinal cord (n = 8 /group). *: p < 0.05; **: p < 0.01; ***: p < 0.005.