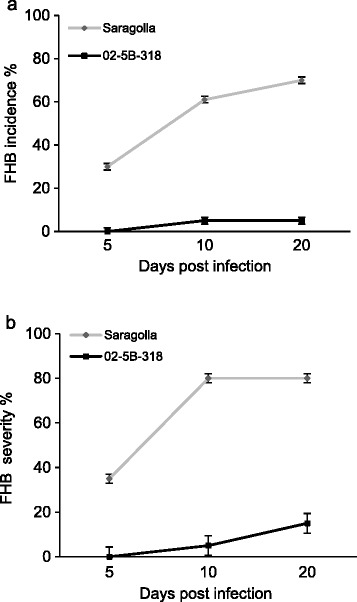
Figure 1.

Time-course analysis of FHB symptoms development following F. graminearum infection. (a) FHB incidence and (b) FHB severity of SaragollaS and 02-5B-318R were evaluated. Data are the average ± standard deviation of two independent experiments (n ≥ 20). The average values of SaragollaS and 02-5B-318R lines are significantly different according to Student’s t test (p < 0.001).
