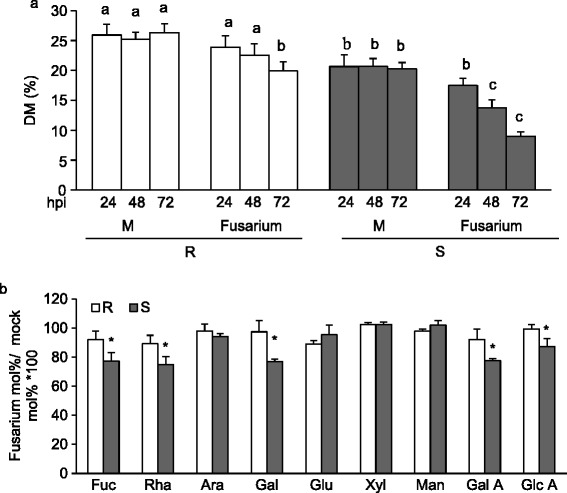
Figure 4.

Characterization of cell wall from spikes of 02-5B-318 R and Saragolla S plants during Fusarium infection. (a) Quantification of degree of pectin methylesterification (DM) at early stages of Fusarium infection. The DM was performed at the indicated hours post-inoculation (hpi). (b) Monosaccharide compositions of matricial polysaccharides was analysed at 72hpi; M, mock-inoculated plants; Fusarium, fusarium-inoculated plants. Data represent the average ± standard deviation (n = 6). The experiment was repeated twice with similar results. The different letters indicate datasets significantly different according to analysis of variance (ANOVA) followed by Tukey’s test (p < 0.05). Asterisks indicate data sets significantly different between 02-5B-318R and SaragollaS according to Student’s t-test (p < 0.05). R = 02-5B-318R; S = SaragollaS.
