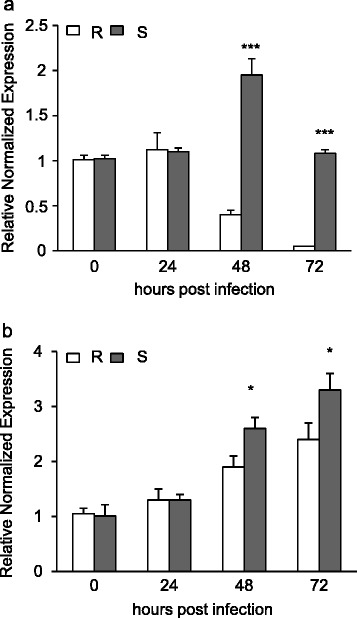
Figure 6.

WheatPME1 and F. graminearum βTUB2 expression in spikes of resistant 02-5B-318 R and susceptible Saragoll S wheat lines during infection. a) WheatPME1 expression was normalized to the average of four different internal references (Actin, CDC, ADP-RF and RLI) reported as fold-change with respect to the mock-inoculated control. b) βTUB2 expression. The expression level was determined at 24, 48 and 72 hpi. Asterisks indicate data sets significantly different according to Student’s t-test (***p < 0.001; *p < 0.05). R = 02-5B-318R; S = SaragollaS.
