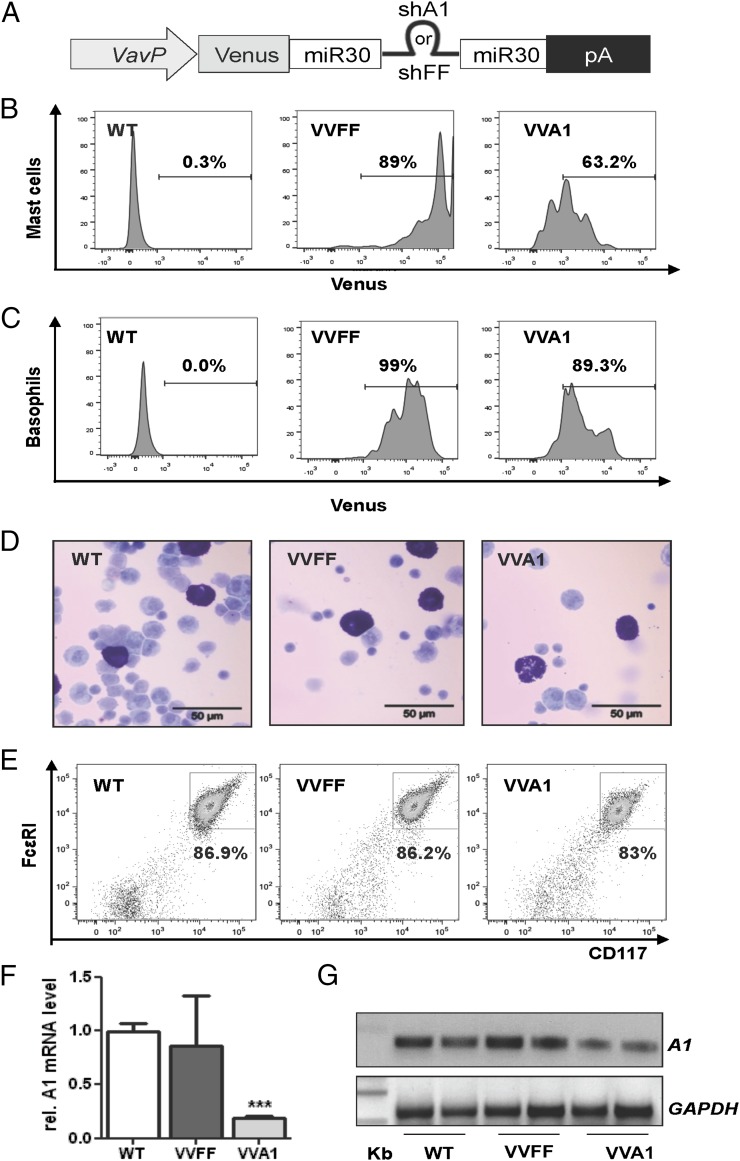
FIGURE 1.
The Vav gene promoter drives mi-shRNA expression in mast cells. (A) Schematic representation of plasmids used for mouse transgenesis. Venus transgene expression in CD117+FcεRI+ peritoneal mast cells (B) and basophils (C) from VVA1 and VVFF mice compared with nontransgenic WT littermate controls. Graphs are representative examples obtained in at least three mice/genotype. Percentages refer to Venus+ cells. (D) May-Grünwald-Giemsa–stained cytospins of cells derived from peritoneal lavage fluid from WT, VVFF, and VVA1 mice. Mast cells are stained purple. (E) Representative plots show comparable expression of CD117 and FcεRI on PCMCs expanded for 1 wk in culture. Knockdown efficiency was evaluated by qRT-PCR (F) and conventional RT-PCR (G) on cDNA generated from PCMCs using primers amplifying all A1 isoforms and GAPDH for normalization. Images have been gray scale inverted for easier visualization of PCR products. Data from three individual PCMC cultures are shown as means in (F). ***p < 0.001, versus WT and VVFF PCMCs, Student t test.

