FIGURE 2.
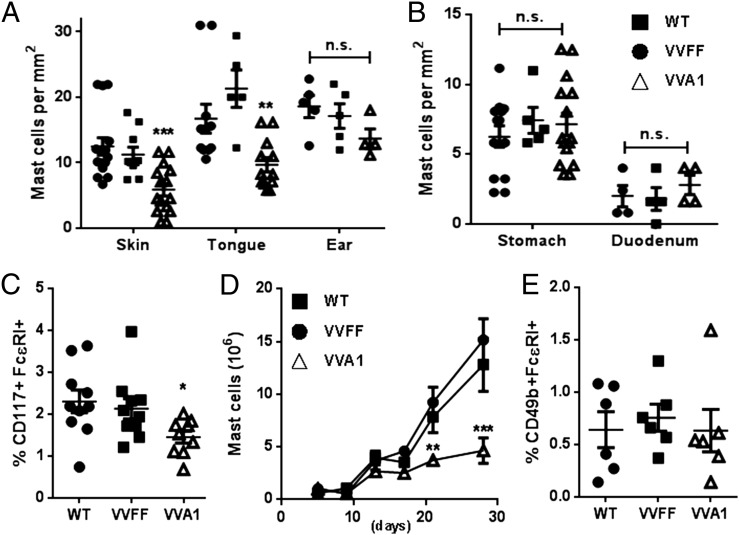
Loss of CTMCs in A1-knockdown mice. Enumeration of mast cells/mm2 in skin, tongue, and ear pinna (connective tissue) (A) and in the glandular stomach wall and duodenum (mucosal tissues) (B) was performed using ImageJ (n = 5–15 animals/genotype). **p < 0.01, ***p < 0.001, versus WT and VVFF mice, Student t test. (C) Percentage of mast cells (FcεRI+ CD117+) in the peritoneal cavity. *p < 0.05, versus WT mice, Student t test. (D) Proliferation of PCMCs in culture was monitored over 4 wk. **p < 0.01, ***p < 0.001, versus WT and VVFF cells, two-way ANOVA with Bonferroni correction for multiple comparisons. (E) Percentage of basophils (FcεRI+ CD49b+) in the peritoneal cavity. n.s., not significant.

