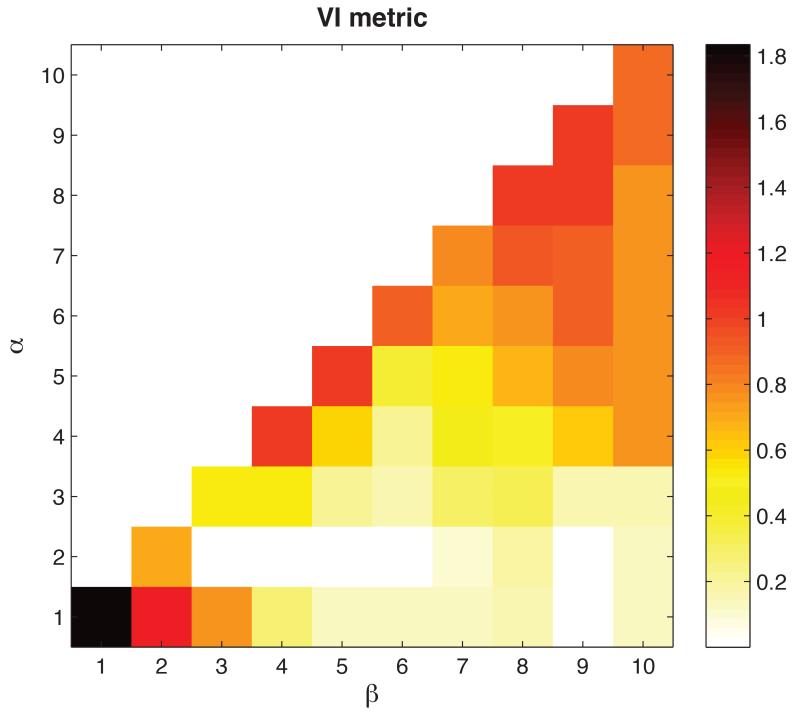
Figure 2.
The effect of varying α and β in Equation (1) for the simulated 1000-dimensional dataset with 7 clusters. The plot shows a pseudocolor representation of performance measured using the Meila VI metric for various values of α and β using BIC penalty.

