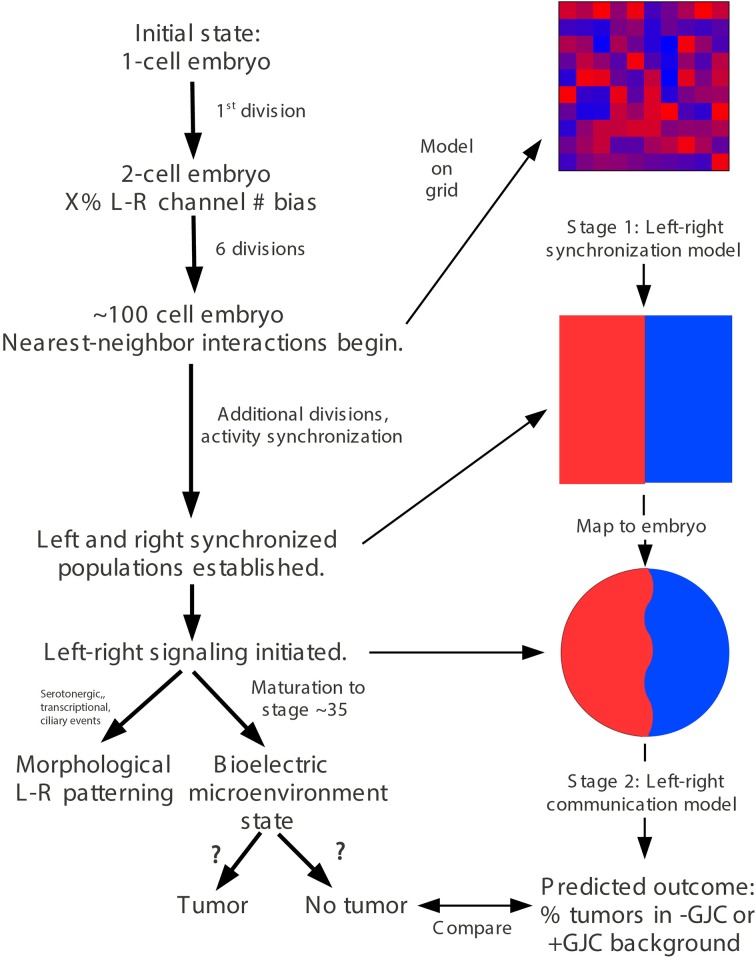
Figure 4.
“Left-right synchronization” model for the establishment (Stage 1) of electrical states that modify long-range gap-junction-mediated influences on tumorigenesis. The “left-right synchronization” model shows that stable, bioelectrically-synchronized cell populations on the left and right sides of the embryo, here represented by red and blue regions, can be generated from a random initial state by nearest-neighbor interactions alone. This model is implemented on a fixed 10 × 10 grid with the left and right exterior boundaries mathematically identified to yield a cylindrical topology. This topology allows the two synchronized populations to “wrap” around the exterior border. The final model shown here was obtained by varying the left—right polarization bias parameter “X” while requiring two stable populations with no ectopic islands as output. This procedure allowed the value of the left—right polarization bias to the predicted to be 27%, consistent with observations (Levin et al., 2002; Adams et al., 2006). While the left-right border is represented at low resolution in the model and most solutions produce a straight, sharp boundary, this is not a biologically-meaningful constraint and the actual border between “left” and “right” cell populations in the embryo may be irregular as shown. The “left-right communication” model assumes that the two bioelectrically-synchronized sides exchange a long-range, oscillatory bioelectric signal; whether this signal requires an additional trigger for initiation is currently unknown. This model employs a small set of assumptions to quantitatively predict the tumor incidence expected when GJC is either suppressed by H7 or enhanced by Cx26. These predictions are then compared with experimental tumor frequencies (indicated by “?”). See Figure 5 for additional details of this model.

