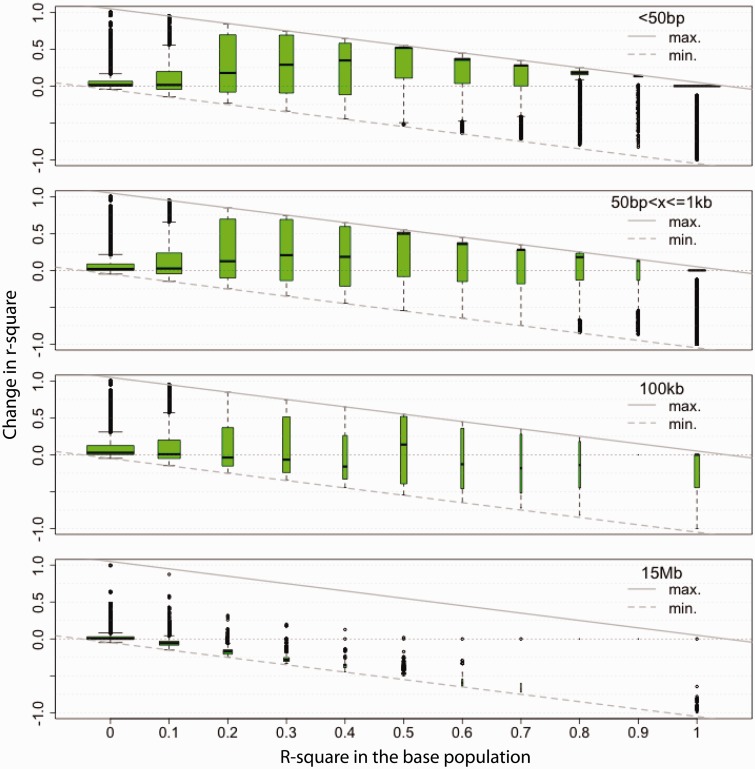
Fig. 2.
Change in LD after 67 generations of evolution depends on the initial LD levels. Results for chromosome arm 3R (plots for remaining chromosome arms are in supplementary fig. S7, Supplementary Material online). Boxplots indicate LD change after 67 generations (y axis) for different categories of initial LD values (x axis). In each row, SNPs with different spacing are shown: ≤50 bp (first row), 51 bp–1 kb (second row), 99–100 kb (third row), and 14.999–15 Mb (fourth row). Solid and dashed diagonal lines indicate the maximum and minimum possible change in LD, respectively. Width of the boxes is scaled by category size (i.e., number of pairwise comparisons). r2 was calculated for matched SNPs polymorphic in both populations. Across all chromosome arms the following patterns are present: 1) In the short range (≤1 kb), where recombination events are very rare, LD increase is more likely if initial LD is present; 2) if new recombination events are more frequent (distances ∼100 kb), LD increase is no longer facilitated by initial LD; LD in the starting population typically decreases for large distances when new recombination events are frequent (∼15 Mb); 3) for the majority of SNPs, r2 takes extreme values (close to either zero or one); and 4) over short distances most SNPs experience change in LD as initial LD is high and recombination during the experiment can be neglected.

