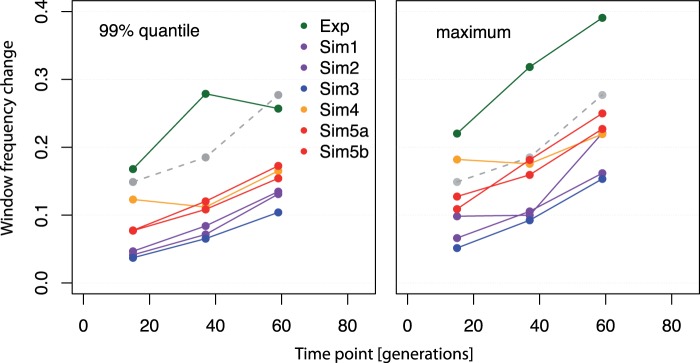
Fig. 6.

Frequency change of singleton-SNP windows in experimental and simulated data. Dots show the frequency changes from the base to respective generation (F15, F37, and F59) of the singleton-SNP windows used for haplotype-block identification (see Materials and Methods). The left panel shows the 99% quantile and right panel the maximum frequency change of all singleton-SNP windows. Different colors show the experimental data (Exp) and the neutral simulations (Sim1–3: Ne = 250, Sim4–5: Ne = 150, see Materials and Methods, supplementary table S1, Supplementary Material online). The gray dots joined by the dashed line represent the thresholds used for haplotype-block identification.
