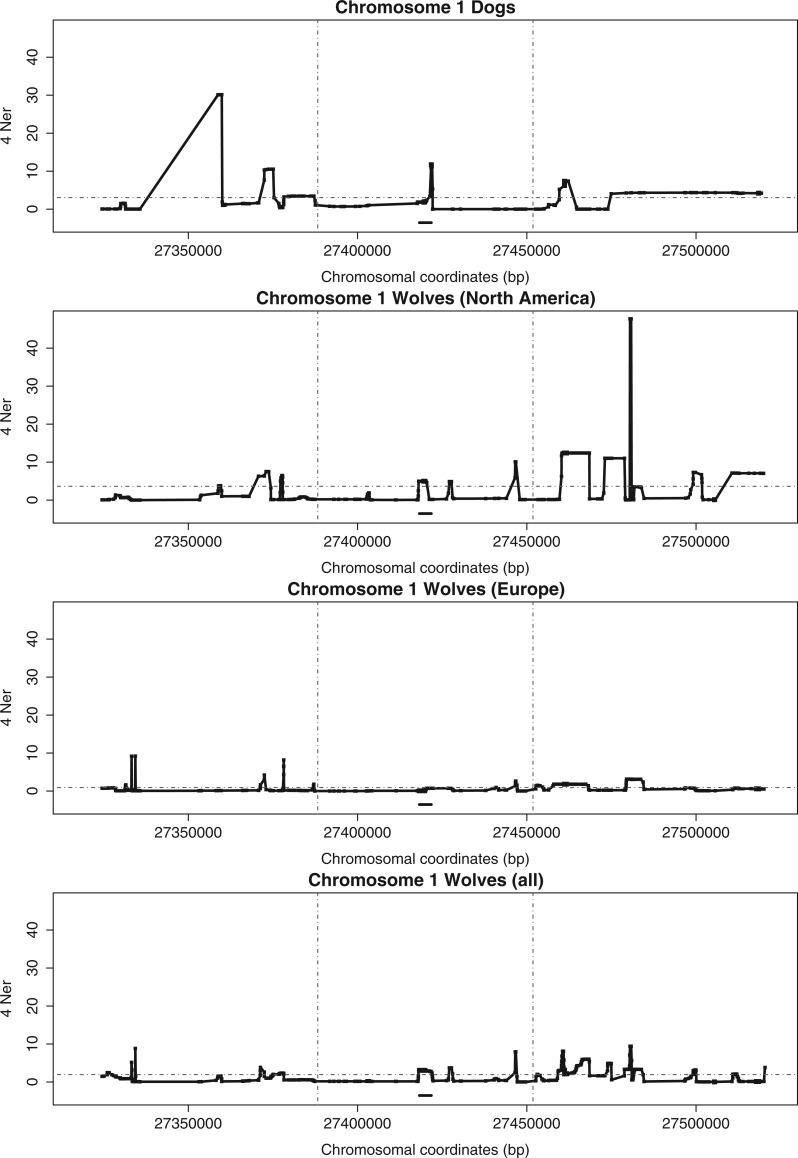
Fig. 3.
Genetic maps for dogs and wolves. Genomic region 1 (table 1) is shown here (see supplementary fig. S3, Supplementary Material online, for all regions). Each dot indicates the mean ρ = 4Ner estimates between each pair of SNPs (penalty 5). The horizontal thick line above the x-axis shows the location of the locus associated with the phenotypic character (see table 1). The dashed horizontal line indicates the average recombination rate for the region. The vertical dashed lines designate three windows, two of 70 kb in size at the two ends of the region, and a central window of size between 60 and 160 kb (see Results and Methods for details).

