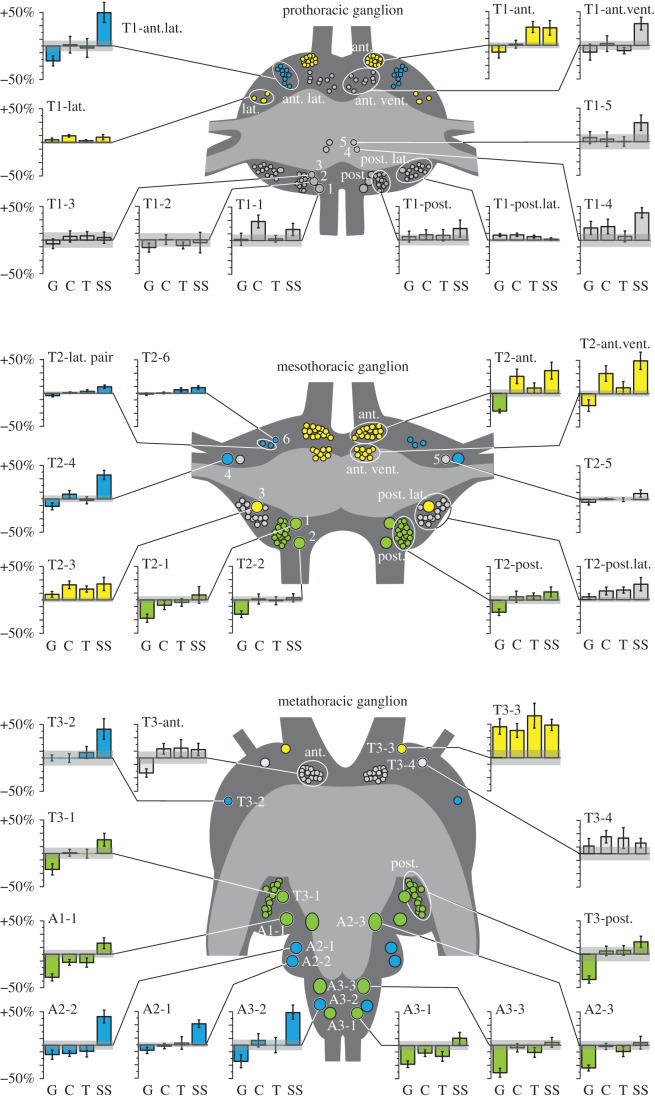
Figure 2.
The responses of serotonergic neurons in the thoracic ganglia to different gregarizing treatments: long-term gregarious (G; n = 12); crowded with 20 other locusts for 1 h (C; n = 12); tickled on a hind femur for 1 h (T; n = 12); and exposed to the sight and smell of a gregarious colony cage for 1 h (SS; n = 7). The bar plots show the percentage change in serotonin immunofluorescence relative to mean long-term solitarious values and the grey bar gives the s.e.m of that value (n = 12). Neuronal somata are shown at 2× natural size and are colour-coded according to effects of treatment: green, significantly different in long-term gregarious locusts; blue, significantly brighter in locusts exposed to the intense sight and smell of other locusts; yellow, affected by two or more of the gregarizing treatments. Somata in grey were no different under any condition.

