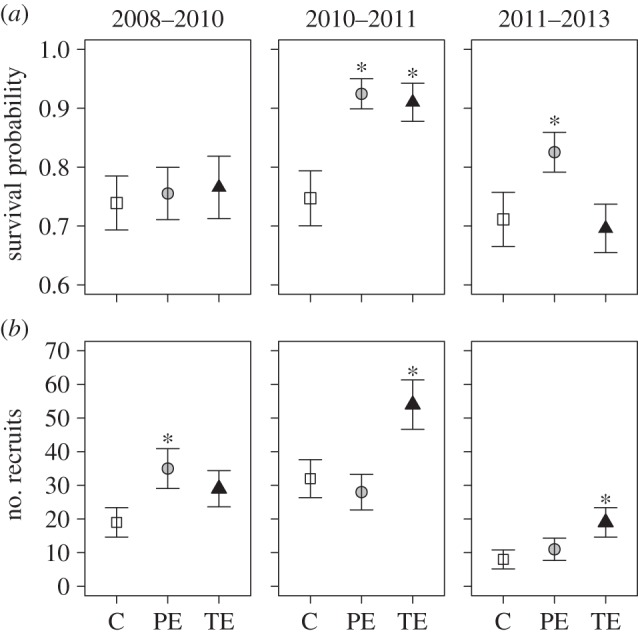
Figure 1.

Temporal changes in (a) survival probability and (b) tree seedling/sapling recruitment among treatments for the three periods of study (values come from Jolly–Seber open population models ± 1 s.e.). C, control plot; PE, partial exclosure; TE, total exclosure. Asterisks (*) indicate significant differences compared with control (p < 0.05).
