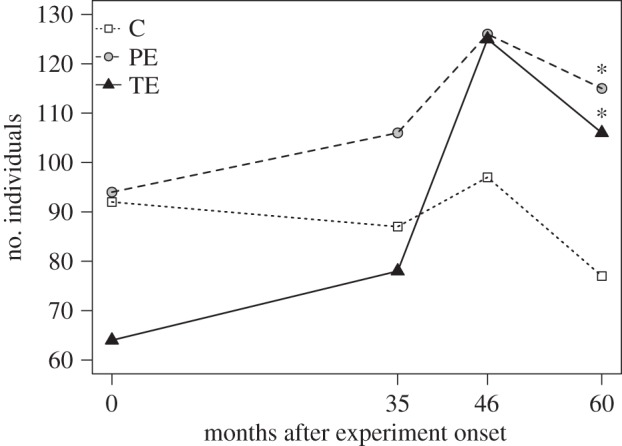
Figure 2.

Plant density for each treatment estimated using Jolly–Seber open population models for 0, 35, 46 and 60 months after the experiment was initiated in MABR southern Mexico. C, control plot; PE, partial exclosure; TE, total exclosure. Asterisks (*) indicate significant differences compared with control (p < 0.05).
