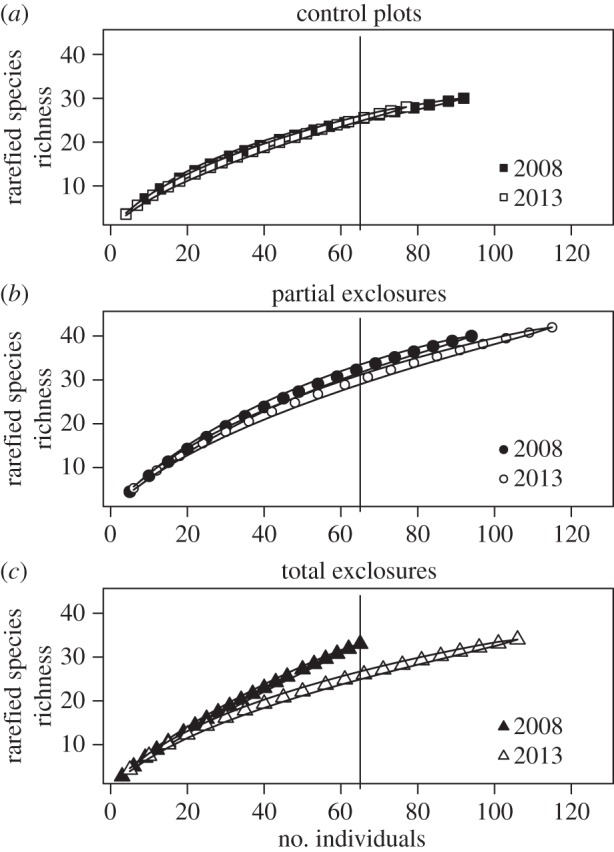
Figure 3.

Rarefaction curves showing changes in species richness between 2008 and 2013 in each of the experimental treatments. Continuous lines represent 95% confidence intervals. Vertical lines show the minimum number of individuals found in any treatment.
