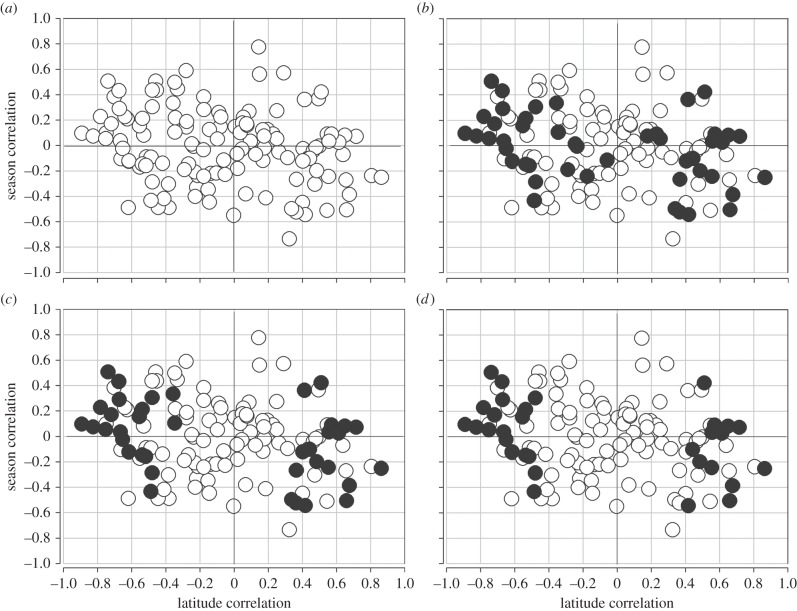
Figure 2.
Correlations between latitudinal change and seasonal change in the same allele. (a) All 128 SNPs across 46 genes (r = −0.222, p < 0.007). (b) Correlation using just the highest latitudinal correlation SNP in each of n = 46 genes (r = −0.398, p < 0.0042). (c) Correlation using clines considered significant at q < 0.10, n = 38 (r = −0.402, p < 0.0076). (d) Correlation using the clines considered significant at q < 0.05, one per gene, n = 31 (r = −0.479, p < 0.0032).

