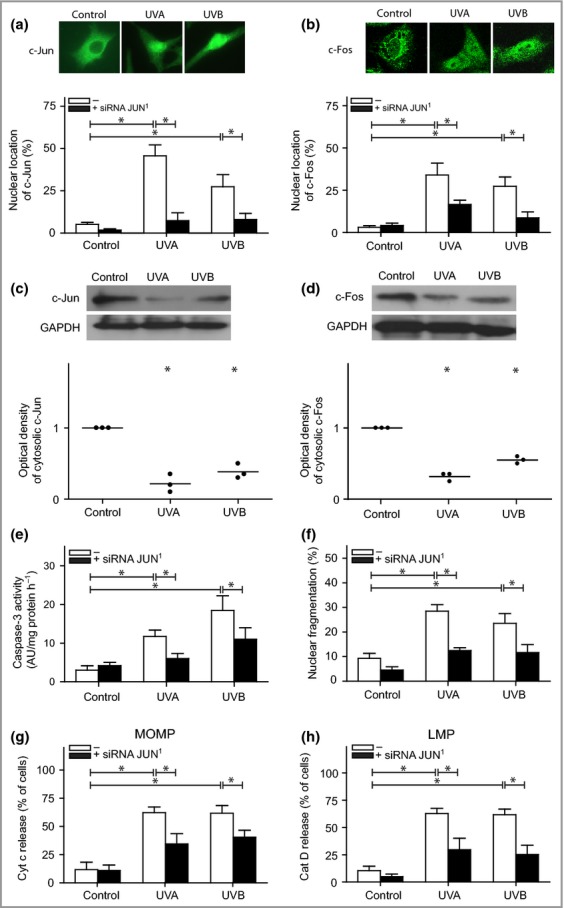
Figure 3.

Activator protein-1 signalling in melanocytes following ultraviolet (UV) exposure. Melanocytes pretreated with JUN small interfering (si)RNA (black bars) 24 h prior to UVA (60 J cm−2) or UVB (500 mJ cm−2) treatment. Quantification of melanocytes showing nuclear staining of (a) c-Jun and (b) c-Fos 4 h after UV exposure. The images were selected to display the characteristic appearance of the nuclear and cytosolic location, respectively. The protein levels and corresponding optical density of (c) c-Jun and (d) c-Fos in digitonin-extracted cytosolic fractions are shown from one representative Western blot out of four. Glyceraldehyde-3-phosphate dehydrogenase (GAPDH) was used as an internal control. (e) Caspase-3 activation was analysed based on the cleavage of the substrate Ac-DEVD-AMC, 16 h postirradiation [expressed as arbitrary unites (AU) per mg protein and hour] and (f) apoptosis was quantified through microscopic inspection of nuclear morphology in 4',6-diamidino-2-phenylindole (DAPI)-stained cells after 24 h. UV-induced (g) mitochondrial outer membrane permeabilization (MOMP), as detected by cytochrome c release, and (h) lysosomal membrane permeabilization (LMP), as detected by the release of cathepsin D (cat D) to the cytosol. The results are presented as the mean ± SD (n = 4). *P ≤ 0·05 vs. control.
