Figure 3.

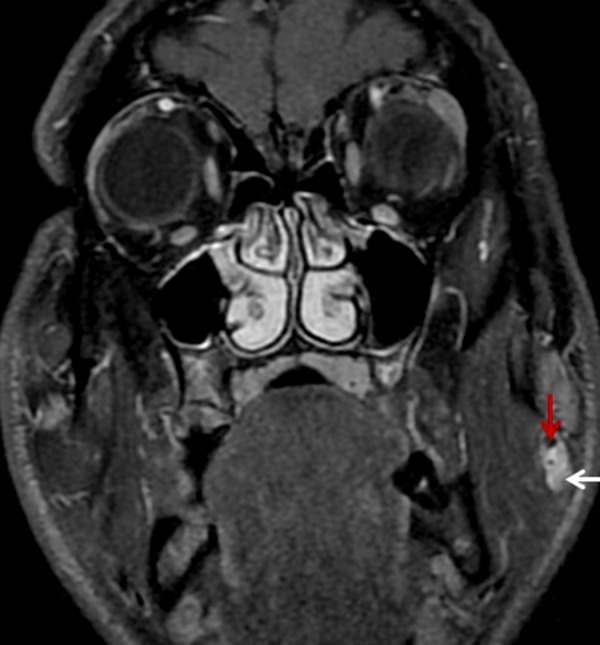
Contrast-enhanced T1-weighted images showing a marked enhancement of the intra-masseteric lesion (white arrow), except for the rounded area of signal hypointensity, which corresponds to a calcification (red arrow).

Contrast-enhanced T1-weighted images showing a marked enhancement of the intra-masseteric lesion (white arrow), except for the rounded area of signal hypointensity, which corresponds to a calcification (red arrow).