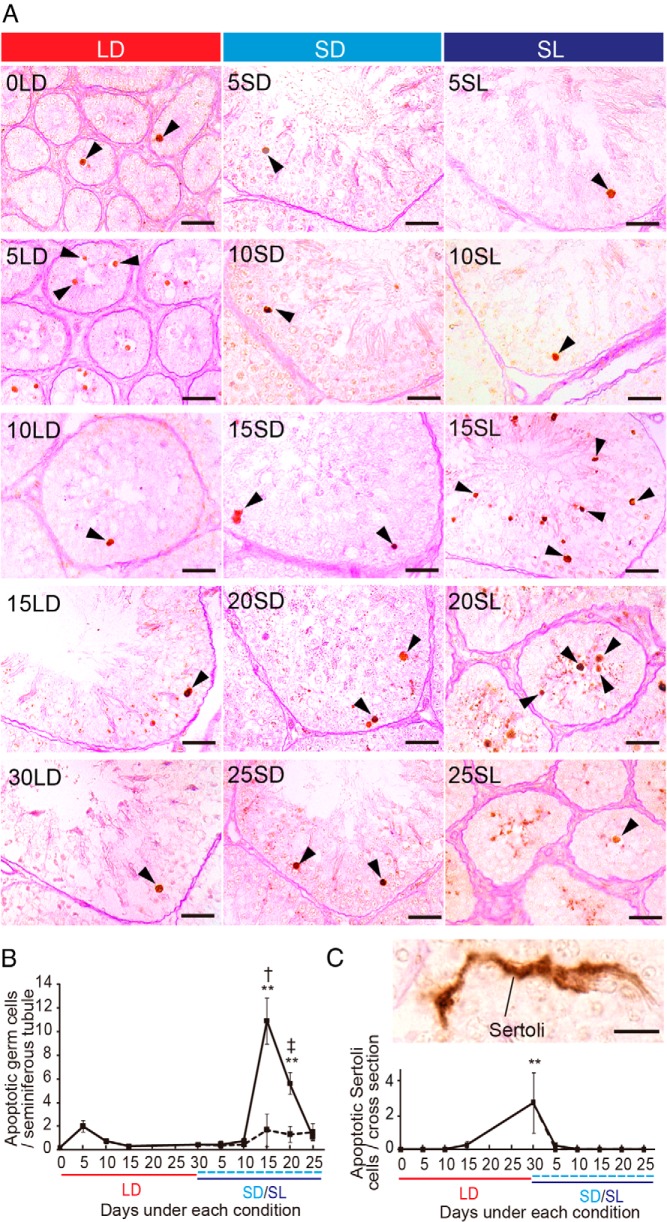
Figure 2.
Changes in number of apoptotic germ cells and Sertoli cells. A, Representative photomicrographs of TUNEL-labeled germ cells (arrowhead). B, The number of apoptotic germ cells per seminiferous tubule. **, P < .01 vs 0LD (ANOVA); †, P < .05 SL vs SD (t test, n = 4–5). C, Representative photomicrograph of a TUNEL-positive Sertoli cell and the number of such cells per cross-section (but not per seminiferous tubule). Scale bars, 25 μm (A) and 10 μm (C).

