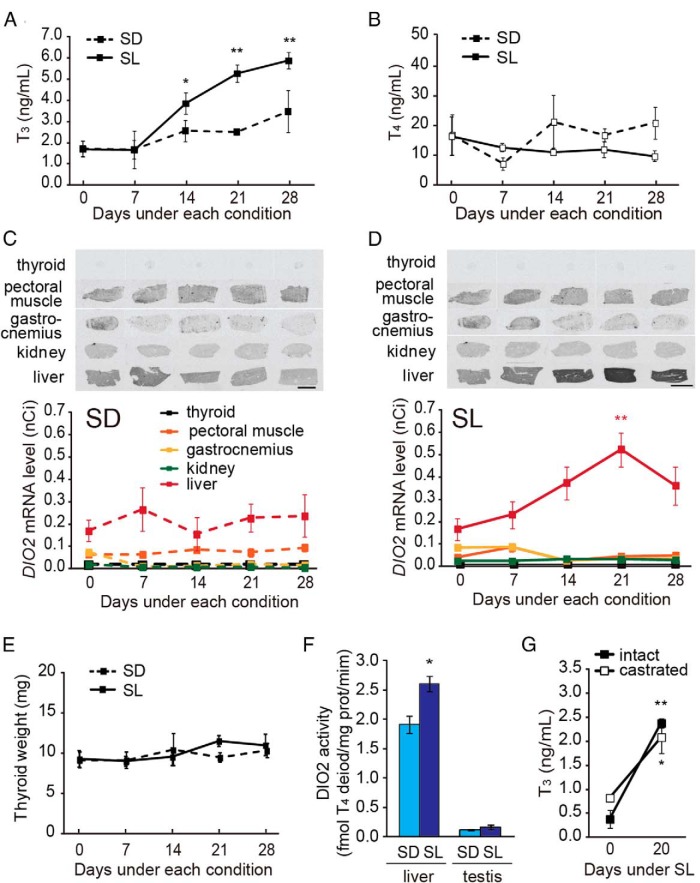
Figure 7.
Identification of the tissue responsible for low temperature-induced serum T3. A and B, Changes in serum T3 (A) and T4 (B) levels under SD (dashed line) and SL (solid line) conditions. *, P < .05; **, P < .01 vs day 0. C and D, Changes in DIO2 mRNA in various tissues under SD (C) and SL (D) conditions. Representative autoradiograms (top panel) and densitometric quantification (bottom panel) are shown. **, P < .01 vs day 0. Scale bars, 1 cm. E, Size of thyroid gland did not change under SD and SL conditions. F, DIO2 activity in liver and testis under SD and SL conditions. Samples were collected 28 days after transferred to each condition. *, P < .05 (t test, n = 3–6). G, Castration did not affect low-temperature-induced serum T3 level. *, P < .05; **, P < .01 day 0 vs day 20 (t test, n = 6–8). All samples were collected at 3 hours after dawn under SD/SL condition (ie, midday).

