
Figure 8.
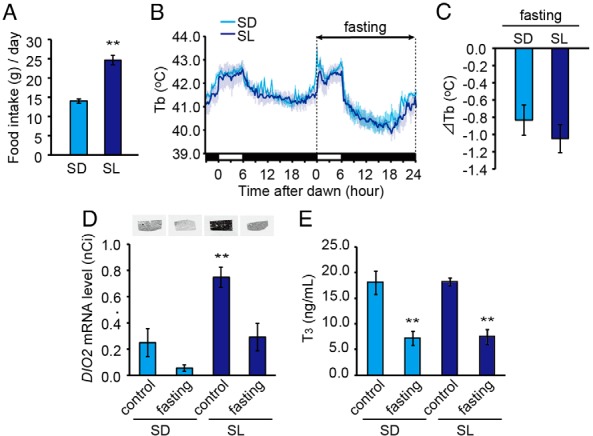
Increased food intake is required for low temperature-induced DIO2 expression in the liver. A, Food intake per day measured at 21 days after transfer to SL and SD conditions. **, P < .01 (t test). B and C, Effect of fasting on body temperature (Tb) at 21 days after transfer to SD (light blue) and SL (dark blue) conditions. Light blue and gray shading indicate the SEM. D, Effect of fasting on hepatic DIO2 expression. Samples were collected 12 hours after dawn when the lowest body temperature was observed. Representative autoradiograms (top panel) and densitometric quantification (bottom panel) are shown. E, Effect of fasting on serum T3 levels (mean ± SEM, n = 4–6). **, P < .01 vs SD control (ANOVA, Dunnett's post hoc test).