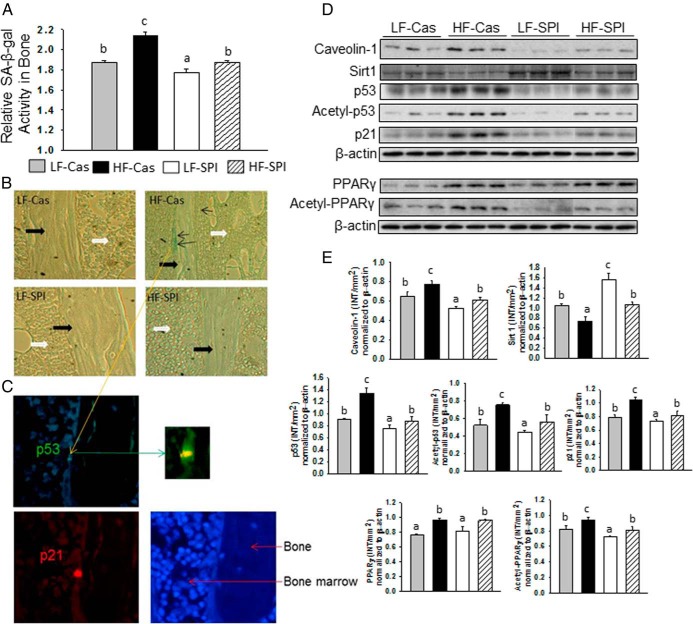
Figure 2.
Senescence activated pathway in osteoblastic cells and accumulation in bone. A, SA-β-gal activity analyses in total proteins isolated from bone after aspiration of bone marrow cells with 4 different diet groups was performed using an ELISA method. Data are expressed as means ± SD (n = 9 per group). Means with different letters differ significantly from each other at P < .05. B, SA-β-gal activity staining in long bone sections from 4 different diet groups. Pictures are illustrating typical bone surface clustered SA-β-gal–positive blue osteoblasts only in bone from HF-Cas rats in a sagittal section under ×20 magnifications. Thick black arrows indicate trabecular bone spicule and white arrows indicate bone marrow area; thin black arrows indicate positive senescent osteoblastic cells. C, SA-β-gal–positive blue osteoblasts from HF-Cas rat coexpress senescence markers p53 and p21. The photograph illustrates 1 double-positive cell with p21 red and p53 green and 4′,6-diamidino-2-phenylindole staining for nucleus. D, Western blots of caveolin-1, Sirt1, total p53, acetylated p53, p21, PPARγ, acetylated PPARγ, and β-actin are depicted for 3 samples from 4 different diet groups. Nine samples from each group were pooled to 3 samples per group. E, The bar graphs represent the ratio of intensity of the band of caveolin-1, Sirt1, total p53, acetylated p53, p21, PPARγ, acetylated PPARγ normalized to β-actin protein for each 3 samples from 4 different diet groups using Quantity One software (Bio-Rad). Data are expressed as means ± SD. Means with different letters differ significantly from each other at P < .05 by two-way ANOVA followed by the Tukey-Kramer post hoc test for pairwise comparisons.

