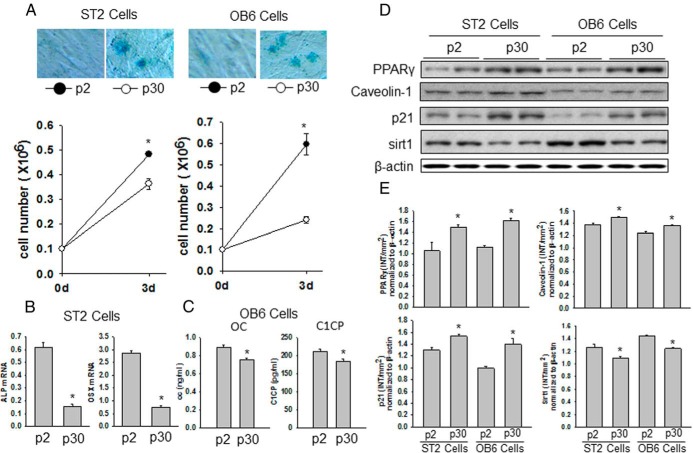
Figure 5.
Senescent osteoblastic cells display increased PPARγ expression and decreased osteocalcin secretion. A, OB6 cells (right) and ST2 cells (left) were passaged either 2 (p2) or 30 times (p30); SA-β-gal–positive blue-stained senescent OB6 and ST2 cells were found in p30. Below the photographs, the graphs show significantly reduced proliferation of p30 OB6 and ST2 cells compared with that of p2 cells. B, mRNA was isolated from p2 and p30 ST2 cells. Osteoblastic cell differentiation markers alkaline phosphatase (ALP) and osterix (OSX) mRNA expression were determined using real-time PCR. C, Secreted osteocalcin (OC) and C1CP in culture medium were measured using ELISA after both p2 and p30 OB6 cells were cultured. D, Proteins were isolated from both p2 and p30 OB6 and ST2 cells. Western blots for PPARγ, caveolin-1, p21, and Sirt1 are shown. E, The bar graphs represent the ratio of intensity of the band of PPARγ, caveolin-1, p21, and Sirt1 protein expression normalized to β-actin protein for each 2 samples from p2 and p30 cells using Quantity One software (Bio-Rad). *, P < .05, p2 vs p30.

