
Figure 2.
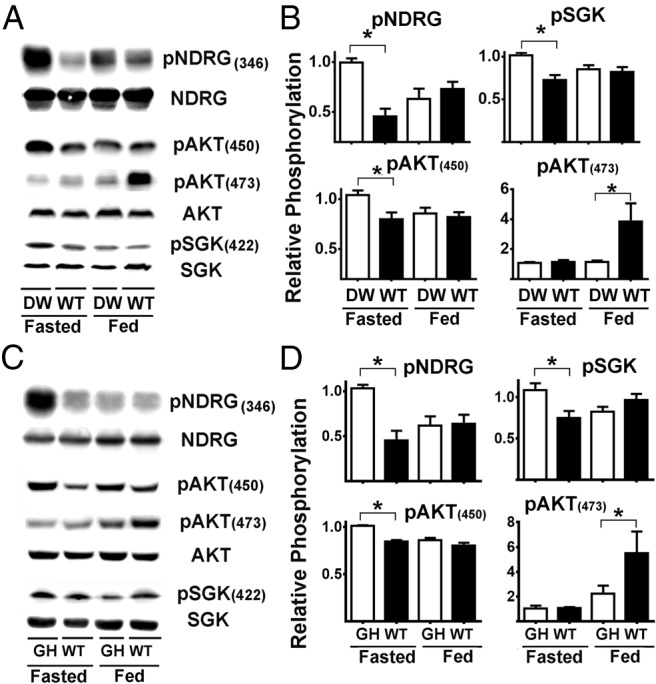
mTORC2 is differentially regulated in liver of DW and GHR−/− mice. A, Representative Western blottings showing the phosphorylation status for NDRG, SGK, AKT at (450), and AKT at (473) in liver samples from DW and control litter mates (WT) under fasted or fed condition. B, Quantification of pNDRG, pSGK, and pAKT (450) and (473) ratios. C, Representative Western blottings showing the phosphorylation status for NDRG, SGK, AKT at (450), and AKT at (473) in liver samples from GHR−/− (GH) and control litter mates (WT) under fasted or fed condition. D, Quantification of pNDRG, pSGK, and pAKT (450) and (473) ratios. All bar graph represents the mean ± SEM of 3 experiments, from a total of 16 mice (8 females and 8 males), after normalization to the ratio of fasted DW or GHR−/−, respectively, samples. An asterisk indicates statistical significance relative to the fasting DW or GHR−/− from each group.