
Figure 3.
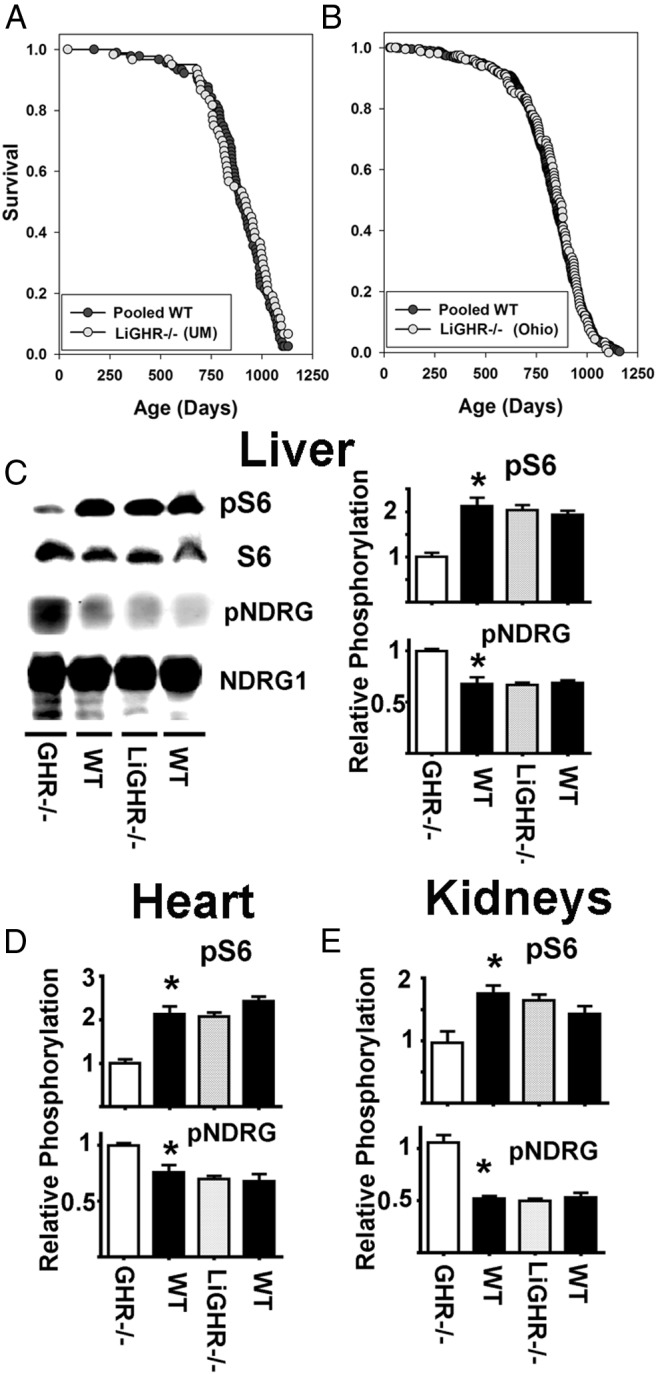
No lifespan extension or changes in mTOR activity in the liver-specific GHR−/− mice. A, Kaplan-Meier survival curves for combined male and females WT (•) and LiGHR−/− (○) at University of Michigan site (UM). B, Kaplan-Meier survival curves for combined male and females WT (•) and LiGHR−/− (○) at the Ohio University site (OH). LiGHR−/− and controls were in a C57BL/6 background. C, Representative Western blottings showing the phosphorylation status for pS6 (for mTORC1) and pNDRG (mTORC2) in liver samples from GHR−/−, LiGHR−/−, and respective control litter mates (WT) under fasting condition. The bar graph represents the mean ± SEM of 3 experiments, from a total of 12 mice (6 females and 6 males), after normalization to the GHR−/− samples. An asterisk indicates statistical significance relative to the GHR−/−, whereas no significant differences were seen comparing LiGHR−/− with their controls. D and E show parallel results for heart and kidney, respectively.