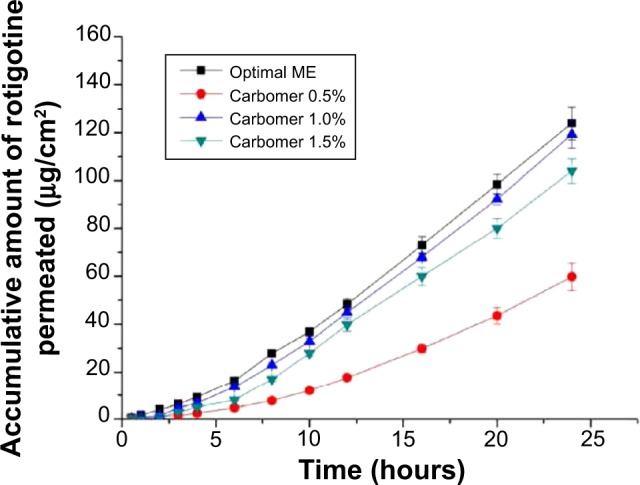
Figure 6.

Accumulated amount of rotigotine that permeated from the optimal formulation of the rotigotine microemulsion gels at different Carbomer concentrations (w/w).
Note: The values represent the mean ± SD (n=3).
Abbreviations: ME, microemulsion formulation; SD, standard deviation.
