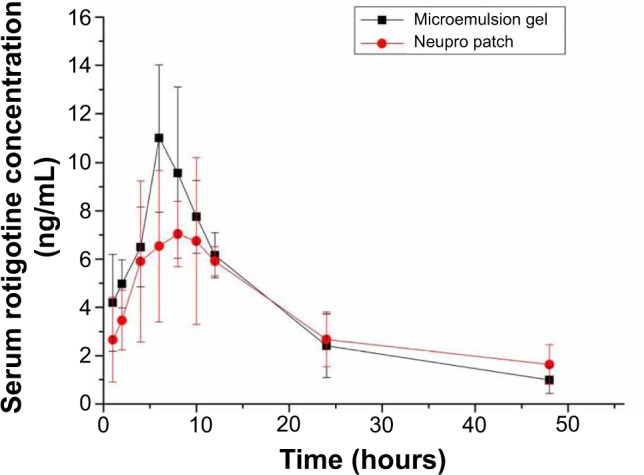
Figure 7.

Drug–time curves in rats administered the rotigotine microemulsion gel and Neupro® patch.
Note: Each point represents the mean ± SD (n=6).
Abbreviation: SD, standard deviation.

Drug–time curves in rats administered the rotigotine microemulsion gel and Neupro® patch.
Note: Each point represents the mean ± SD (n=6).
Abbreviation: SD, standard deviation.