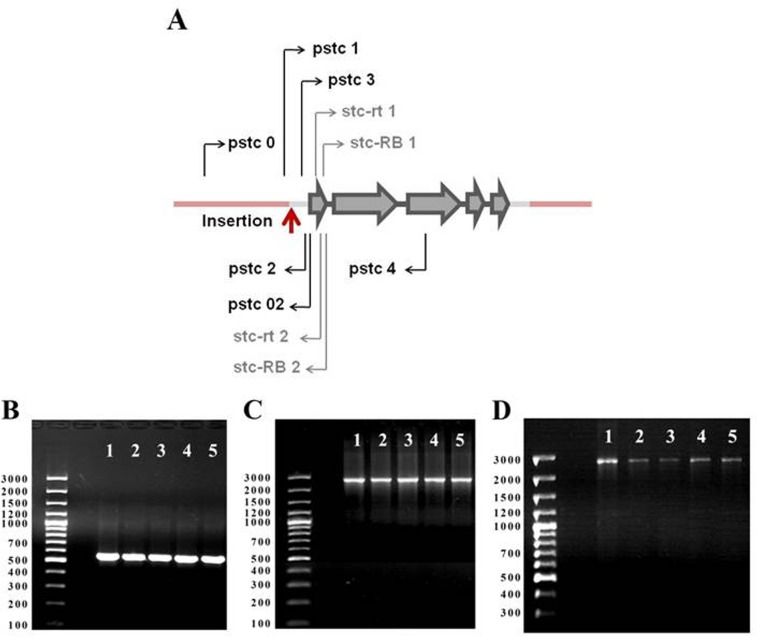
Figure 1.
stc gene map and PCR analysis of stc structure in revertant lines. (A) stc gene map. Gray arrows: exons; black sections:introns; gray sections: untranslataed regions; pink sections: background sequences; red arrow: P{SUPor-P}stcKG01230 insertion site; black arrows: primers used for PCR; gray arrows: primers used for Real Time RT-qPCR. (B) PCR with primers pstc1 and pstc2 (expected product size 555 bp); (C) PCR with primers pstc0 and pstc02 (expected product size 2508 bp); (D) PCR with primers pstc3 and pstc4 (expected product size 2562 bp). 1: control line; 2: rev1, 3: rev3, 4: rev4; 5: rev5.

