
Figure 3.
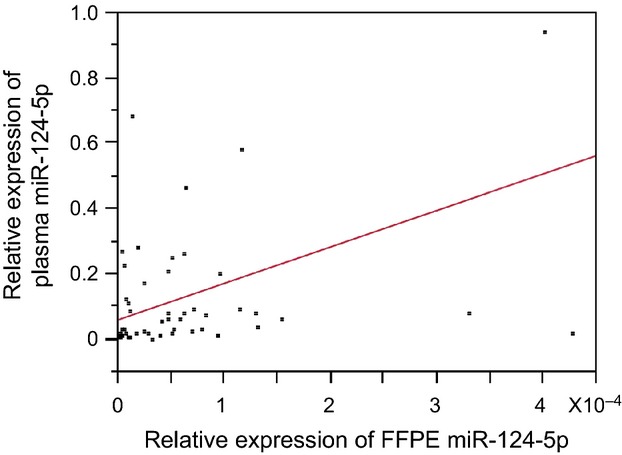
The correlation between expression levels of formalin-fixed paraffin-embedded (FFPE) miR-124-5p and plasma miR-124-5p. The relationship was analyzed by using univariate analysis, r = 0.451, 95% confidence interval: 0.189 − 0.654, P = 0.002. The plots from paired samples from the same patient and regression line were indicated.