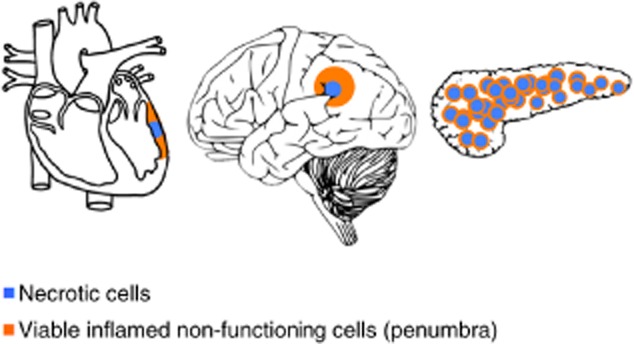
Figure 1.

The penumbra effect illustrated. The outcome of an injured section of tissue separates into the immediate centre of cell death and a surrounding perimeter of viable cells that are stunted due to the spread of inflammation, as depicted in a blocked coronary artery (left), stroke (middle) and pancreatic islet injury (right). Blue = necrotic area; orange = viable stunted cells.
