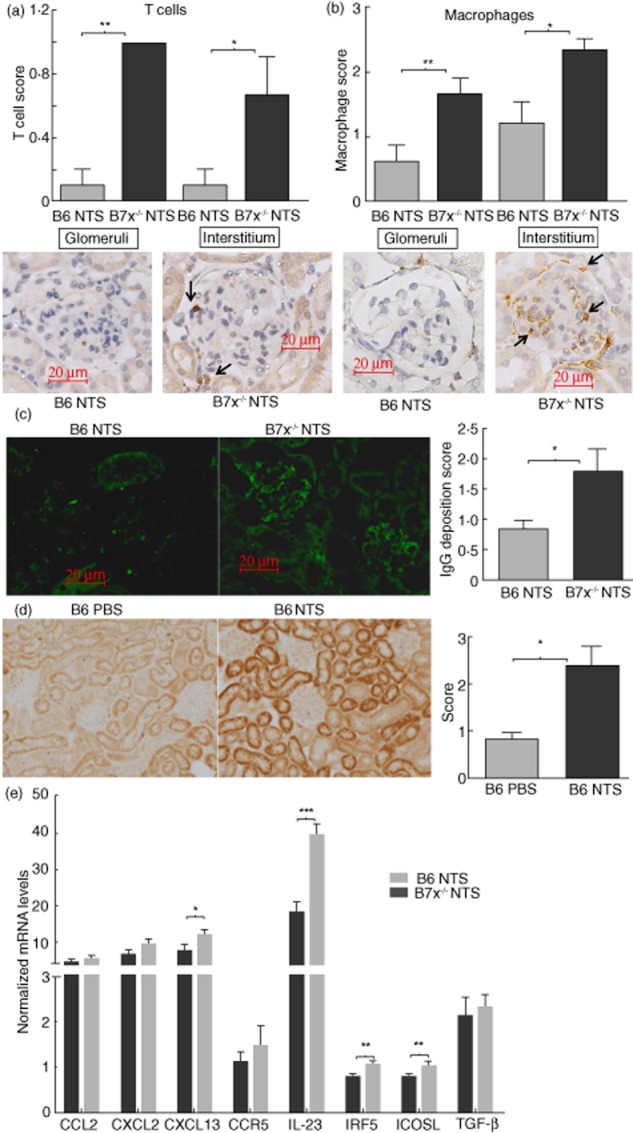
Figure 3.

Exacerbated infiltration of immune cells, immunoglobulin (Ig)G deposition and inflammatory mediator expression in kidneys of B7x−/− mice post-nephrotoxic serum (NTS). (a,b) Immunohistochemical analysis of infiltrating CD3+ T cells and CD68+ macrophages in kidneys of B6 and B7x−/− mice. Data are expressed as mean ± standard error of the mean (s.e.m.), n = 9–10 per group. *P ≤ 0·05, by Mann–Whitney U-test. Arrows point to positively stained cells in each panel. (c) IgG deposition analysed by immunofluorescence in kidneys of B6 and B7x−/− mice, with images captured at ×400 magnification. Data are expressed as mean ± s.e.m., n = 6–7 randomly selected mice per group. *P ≤ 0·05, by Mann–Whitney U-test. (d) Immunohistochemical analysis of B7x expression in kidneys of phosphate-buffered saline (PBS) and NTS-challenged B6 mice, with images captured at ×200 magnification. Data are expressed as mean ± s.e.m., n = 8 in the PBS and n = 11 in the NTS group. *P ≤ 0·05, by Mann–Whitney U-test. (e) mRNA expression levels of inflammatory mediators in kidneys of B6 and B7x−/− mice post-NTS challenge, as analysed by real-time polymerase chain reaction (PCR). The relative expression of each mRNA versus glyceraldehyde 3-phosphate dehydrogenase (GAPDH) was calculated and normalized with regard to the baseline level of expression in each strain, with the y-axis scale × 10−3. Data are representative of two independent experiments, and are expressed as mean ± s.e.m., n = 9–10 per group. *P ≤ 0·05, ** ≤ 0·01 and *** ≤ 0·001 by unpaired t-test.
