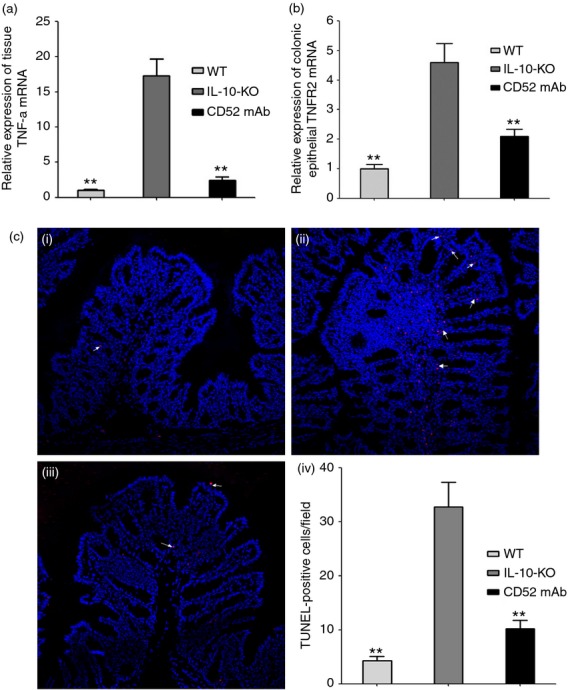
Figure 3.

Cytokine RNA expression and apoptotic cells in the proximal colon of interleukin-deficient (IL-10−/−) mice 4 weeks after the final drug administration. Expression of epithelial tumour necrosis factor receptor 2 (TNFR2) and tissue TNF-α in wild-type (WT), IL-10−/− (IL-10-KO) and CD52 monoclonal antibody treatment (CD52 mAb) mice (a and b; n = 6 to 8). (c) Representative TUNEL (white arrow indicates the apoptotic cells with red fluorescence) immunostains with nuclear counterstain (blue fluorescence) in wild-type (i), IL-10−/− (ii) and CD52 mAb treatment (iii) mice (200 × magnification, n = 4), (iv) Morphometric analysis of apoptotic cells in three groups. Data in this figure are representative of at least three independent experiments. Data were presented as means ± SEM. *P < 0·05 and **P < 0·01 versus IL-10-KO group.
