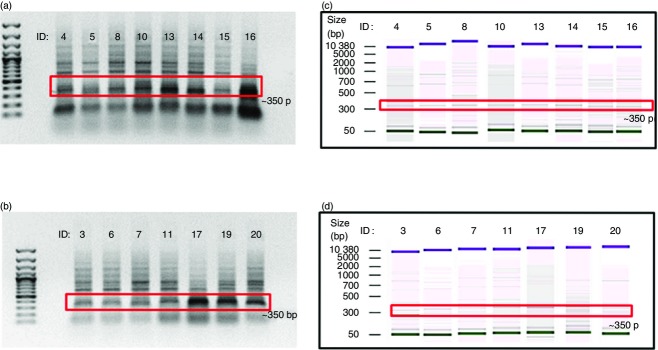
Figure 1.

Agarose gel electrophoresis and Bioanalyzer analysis for VH3N. (a) Agarose gel analysis of TST− population; (b) agarose gel analysis of TST+ population; (c) Bioanalyzer analysis of TST− population; (d) Bioanalyzer analysis of TST+ population. The red box indicates the desired bands of approximately 350 bp in size of the VH3N (VH3-23) genes. DNA marker used is a 100 bp plus DNA Ladder from Fermentas. + control is the amplification of a known V gene and the − control is a non-templated DNA sample.
