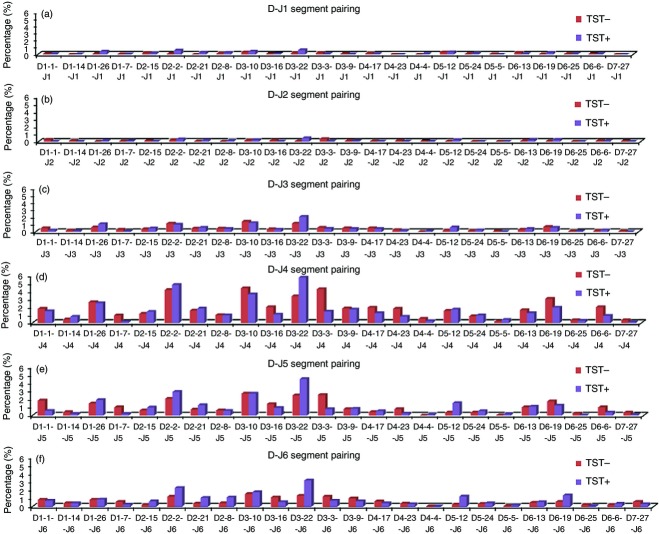
Figure 3.
D and J segments pairing frequency percentage analysis for both TST− and TST+ populations. (a) Pairing frequency of J1; (b) pairing frequency of J2; (c) pairing frequency of J3; (d) pairing frequency of J4; (e) pairing frequency of J5; (f) pairing frequency of J6. All J segments are with the 23 D segments under the given total number of re-combination events.

