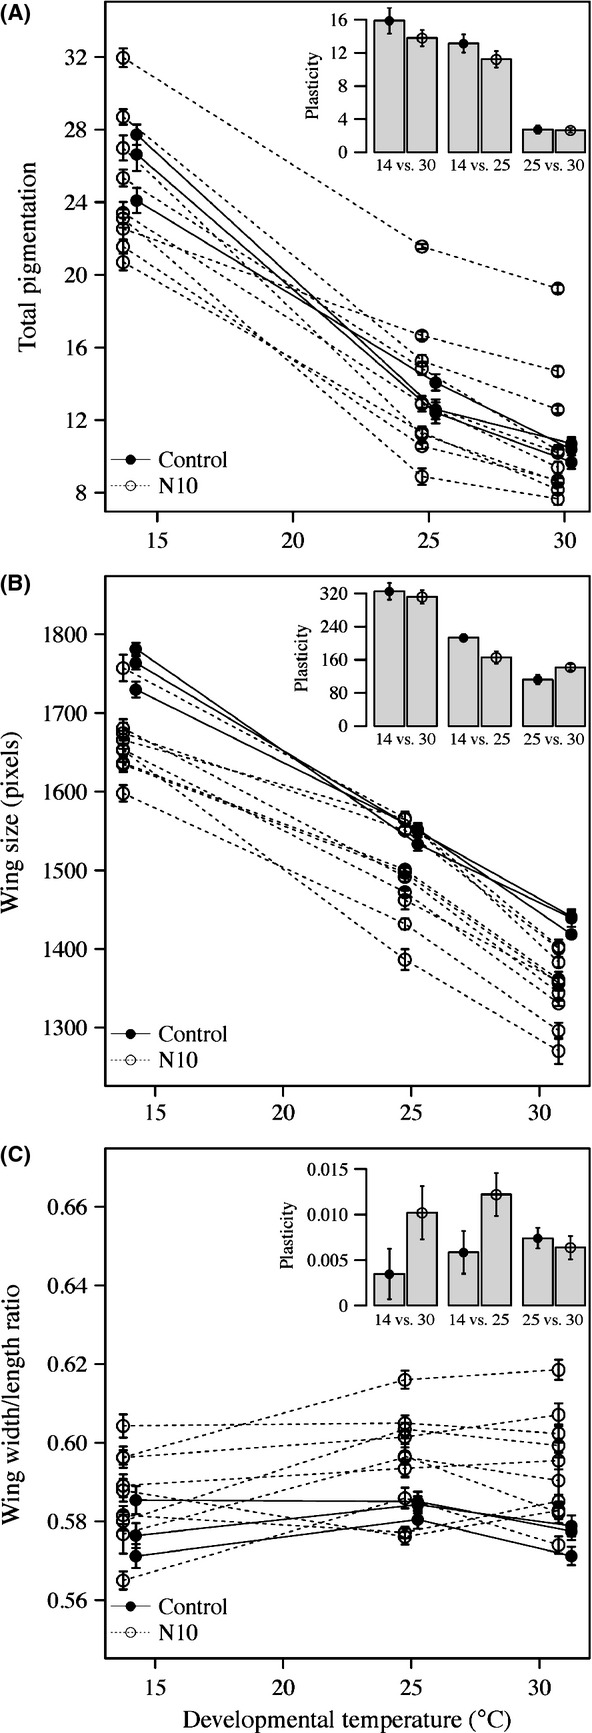
Figure 1.

Norm of reaction for total pigmentation (A), wing size (B), and wing shape (C) of replicate N10 (n = 10) and control (n = 3) populations. In each plot, the plasticity (absolute change in phenotype) for the three contrasts is summarized in a barplot. Error bars are standard errors.
