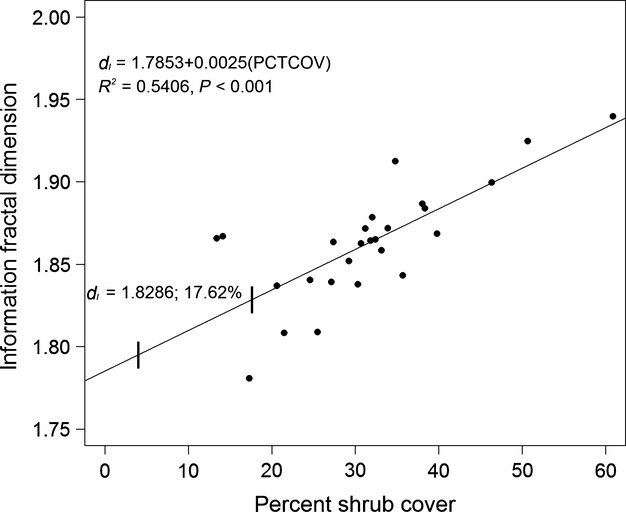
Figure 9.

Scatterplot demonstrating the relationship of the information fractal dimension (dI) for each site at each observed year with their corresponding percent shrub cover (PCTCOV). The regression line equation is dI = 1.7853 + 0.0025(PCTCOV). The vertical lines superimposed on the regression line represent the coordinates of the critical dI values, with the upper critical value of 1.8286 and its corresponding PCTCOV labeled. All sites at all years meet or exceed this upper critical value.
