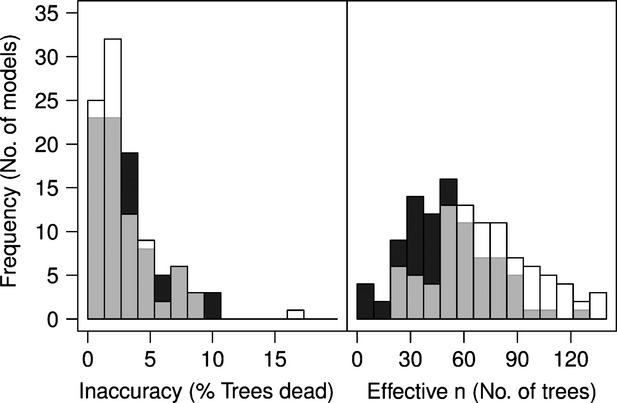
Figure 2.

Left panel: histograms of accuracy of single-species models, |( |ϕ) − qval|. Right panel: Histograms of effective sample size,
  , of single-species models. Dark grey bars in background are for models with vague priors. Transparent white bars in foreground are for models with empirical data-derived priors.
