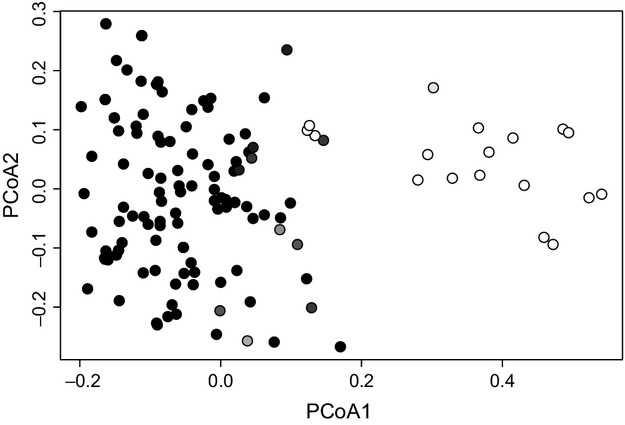
Figure 4.

Principal coordinates analysis (PCoA) comparing 135 multilocus haploid genotypes of Sphagnum warnstorfii across 12 microsatellite markers for the full dataset without clones. The first two principal coordinates account for 46.9% and 15.6% of the total genetic variation. Plants are colored according to STRUCTURE results: first cluster – black, second cluster (“outliers”) – white, admixtures – gray.
