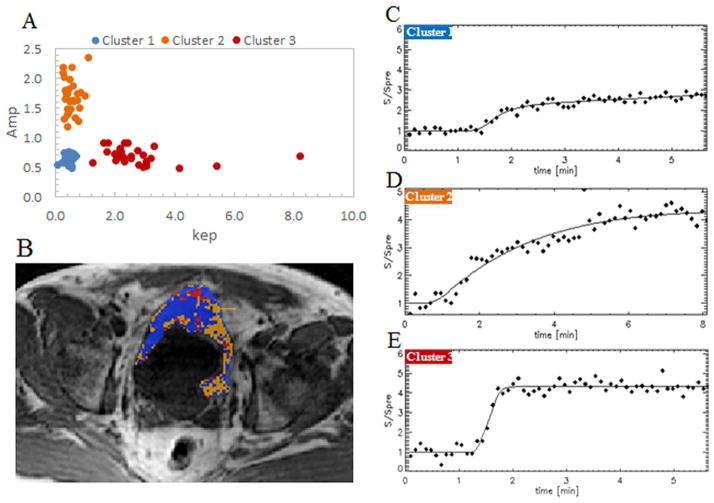
Figure 2. Signal enhancement characteristics of the three clusters.
Image A: The distribution of three cluster centers in the (Amp and kep) space. For each of thirty patients, a set of three cluster centers were determined. Cluster centers of all thirty patients were distributed in the same region.
Image B: A color cluster map. MR image of a male patient, aged 59. In blue, orange, and red are the voxels of cluster 1, cluster 2, and cluster 3, respectively.
Images C, D, E: The signal intensity curves of three clusters. Cluster 1 (blue) with low kep and low Amp has a flat and shallow curve. Cluster 2 (orange) with low kep and high Amp has a high curve. Cluster 3 (red) with high kep and low Amp has a steep-sloped curve.

