
Figure 6.
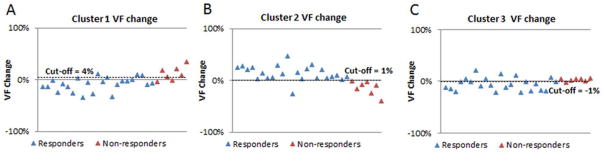
The volume fraction (VF) changes of three clusters from baseline to mid-cycle in responders vs. non-responders. Graphs A, B, C are respectively the VF changes of clusters 1, 2, 3 in twenty-three responders (blue triangles) and seven non-responders (red triangles) with a selected cutoff value (represented by dot lines).