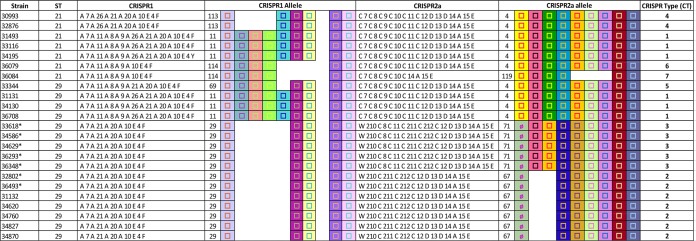
FIG 1.

MLST and CRISPR typing of the O26:H11 clinical isolates. In the graphic representation of spacer arrangements in CRISPR1 and CRISPR2a, each unique spacer is represented by a unique combination of the center shape and background color. The shape in the center indicates the spacer length (□, 32 bp; Ø, 1,293 bp). Gaps were introduced to improve the alignment of similar CRISPR arrays. CRISPR1 and CRISPR2a allele numbers are shown in the respective columns to the left of the CRISPR arrays. Each unique combination of CRISPR1 and CRISPR2a alleles was assigned a CRISPR type (CT) number. *, stx2d-positive strains.
